The Tempestry Project
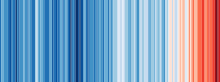
Tempestries are made by knitting or crocheting rows in specified colors that represent respective high temperatures each day for a year.
For many people, that's not their experience and so they don't relate to it in a powerful way...but even here [outside Seattle], in a temperate place, you can see stark change over the last 40 years or so.
[2] Each tempestry is knitted or crocheted, one row each day,[9] in the specified color for each date's high temperature[3] starting on January 1 and ending on December 31 for a given year in a single location to form a banner the size of a scarf[3][10] that graphically represents a year of daily high temperatures in a single location.
[5][16] In May 2019 a project consisting of 27 tempestries representing 100 years on Orcas Island in 4-year increments was displayed at the Pacific Northwest Quilt and Fiberarts Museum.
[17] In 2020 pieces were displayed at the San Juan Islands Museum of Art[18] and at Temple University's Ginsberg Health Sciences Library.
[6][18] In 2019 the Schuylkill Center for Environmental Education [Wikidata] near Philadelphia organized a project using data provided by the Franklin Institute to create tempestries for the city, one for every fifth year from 1875 through 2018.
[20] Grace Ebert, writing for Colossal, calls such projects "part of a larger movement to document micro weather changes that may serve as indicators of broader climate issues.
[24][25] Pennsylvania State University professor Laura Guertin contributed a poster to the American Geophysical Union's 2017 Fall meeting displaying similar works for January through April 1917, 1967, and 2017.
[28] In 2007, artist Eve Mosher used a sports-field chalk marker to draw a blue "high-water" line around Manhattan and Brooklyn, showing the areas that would be underwater if climate change predictions are realized.