Yield curve
[4] Shifts in the shape and slope of the yield curve are thought to be related to investor expectations for the economy and interest rates.
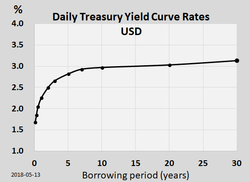
[5] For this reason, many traders closely watch the yield curve for U.S. Treasury debt securities, which are considered to be risk-free.
Therefore, under the arbitrage pricing theory, investors who are willing to lock their money in now need to be compensated for the anticipated rise in rates—thus the higher interest rate on long-term investments.
A risk premium is needed by the market, since at longer durations there is more uncertainty and a greater chance of events that impact the investment.
The opposite situation can also occur, in which the yield curve is "inverted", with short-term interest rates higher than long-term.
Under unusual circumstances, investors will settle for lower yields associated with low-risk long-term debt if they think the economy will enter a recession in the near future.
Investors who had purchased 10-year Treasuries in 2006 would have received a safe and steady yield until 2015, possibly achieving better returns than those investing in equities during that volatile period.
Economist Campbell Harvey's 1986 dissertation[9] showed that an inverted yield curve accurately forecasts U.S. recessions.
[10] In addition to potentially signaling an economic decline, inverted yield curves also imply that the market believes inflation will remain low.
Work by Arturo Estrella and Tobias Adrian has established the predictive power of an inverted yield curve to signal a recession.
Their models show that when the difference between short-term interest rates (they use 3-month T-bills) and long-term interest rates (10-year Treasury bonds) at the end of a federal reserve tightening cycle is negative or less than 93 basis points positive, a rise in unemployment usually occurs.
[16] The New York Fed publishes a monthly recession probability prediction derived from the yield curve and based on Estrella's work.
Over the same time frame, every occurrence of an inverted yield curve has been followed by recession as declared by the NBER business cycle dating committee.
[18][19][20] Estrella and others have postulated that the yield curve affects the business cycle via the balance sheet of banks (or bank-like financial institutions).
When the yield curve is upward sloping, banks can profitably take-in short-term deposits and make new long-term loans so they are eager to supply credit to borrowers.
Two of the theories are extreme positions, while the third attempts to find a middle ground between the former two.This hypothesis assumes that the various maturities are perfect substitutes and suggests that the shape of the yield curve depends on market participants' expectations of future interest rates.
Shortcomings of expectations theory include that it neglects the interest rate risk inherent in investing in bonds.
This premium compensates investors for the added risk of having their money tied up for a longer period, including the greater price uncertainty.
The preferred habitat theory is a variant of the liquidity premium theory, and states that in addition to interest rate expectations, investors have distinct investment horizons and require a meaningful premium to buy bonds with maturities outside their "preferred" maturity, or habitat.
However, because the supply and demand of the two markets are independent, this theory fails to explain the observed fact that yields tend to move together (i.e., upward and downward shifts in the curve).
On August 15, 1971, U.S. President Richard Nixon announced that the U.S. dollar would no longer be based on the gold standard, thereby ending the Bretton Woods system and initiating the era of floating exchange rates.
Floating exchange rates made life more complicated for bond traders, including those at Salomon Brothers in New York City.
One important theoretic development came from a Czech mathematician, Oldrich Vasicek, who argued in a 1977 paper that bond prices all along the curve are driven by the short end (under risk-neutral equivalent martingale measure) and accordingly by short-term interest rates.
The team extended the maturity of European yield curves up to 50 years (for the lira, French franc, Deutsche mark, Danish krone and many other currencies including the ecu).
Because a bond is always anchored by its final maturity, the price at some point must change direction and fall to par value at redemption.
When the yield curve is steep, the bond is predicted to have a large capital gain in the first years before falling in price later.
When the yield curve is flat, the capital gain is predicted to be much less, and there is little variability in the bond's total returns over time.
The greater change in rates at the short end will offset to some extent the advantage provided by the shorter bond's lower duration.
The middle of the curve (5–10 years) will see the greatest percentage gain in yields if there is anticipated inflation even if interest rates have not changed.
Likewise, daily inversions in September 1998 did not result in negative term spreads on a month average basis and thus do not constitute a false alarm.


10 year minus 2 year treasury yield


