Buffon's needle problem
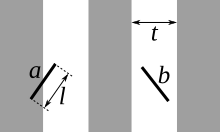
The solution for the sought probability p, in the case where the needle length l is not greater than the width t of the strips, is This can be used to design a Monte Carlo method for approximating the number π, although that was not the original motivation for de Buffon's question.
[3] The seemingly unusual appearance of π in this expression occurs because the underlying probability distribution function for the needle orientation is rotationally symmetric.
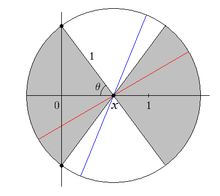
The two random variables, x and θ, are independent,[4] so the joint probability density function is the product The needle crosses a line if Now there are two cases.
The right term represents the probability that the needle falls at an angle where its position matters, and it crosses the line.
The following solution for the "short needle" case, while equivalent to the one above, has a more visual flavor, and avoids iterated integrals.
The farthest this end of the needle can move away from this line horizontally in its region is t. The probability that the farthest end of the needle is located no more than a distance l cos θ away from the line (and thus that the needle crosses the line) out of the total distance t it can move in its region for 0 ≤ θ ≤ π/2 is given by The short-needle problem can also be solved without any integration, in a way that explains the formula for p from the geometric fact that a circle of diameter t will cross the distance t strips always (i.e. with probability 1) in exactly two spots.
This leads to the formula: In 1901, Italian mathematician Mario Lazzarini performed Buffon's needle experiment.
Tossing a needle 3,408 times, he obtained the well-known approximation 355/113 for π, accurate to six decimal places.
[6] Lazzarini's "experiment" is an example of confirmation bias, as it was set up to replicate the already well-known approximation of 355/113 (in fact, there is no better rational approximation with fewer than five digits in the numerator and denominator, see also Milü), yielding a more accurate "prediction" of π than would be expected from the number of trials, as follows: [7] Lazzarini chose needles whose length was 5/6 of the width of the strips of wood.
If one drops 213 needles and happens to get 113 successes, then one can triumphantly report an estimate of π accurate to six decimal places.
A statistical analysis of intermediate results he reported for fewer tosses leads to a very low probability of achieving such close agreement to the expected value all through the experiment.
This makes it very possible that the "experiment" itself was never physically performed, but based on numbers concocted from imagination to match statistical expectations, but too well, as it turns out.
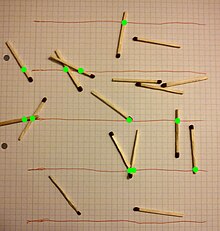
[8] Now consider the case where the plane contains two sets of parallel lines orthogonal to one another, creating a standard perpendicular grid.
Let A be the event that the needle intersects a horizontal line (parallel to the x-axis) and let B be the event that the needle intersects a vertical line (parallel to the y-axis) For simplicity in the algebraic formulation ahead, let a = b = t = 2l such that the original result in Buffon's problem is P(A) = P(B) = 1/π.
Now let us examine P(AB) for Laplace's result, that is, the probability the needle intersects both a horizontal and a vertical line.
Because xn and yn are negatively correlated random variables, they act to reduce the total variance in the estimator that is an average of the two of them.
2 l · n / th = 2 × 9 × 17 / 9 × 11 ≈ 3.1 ≈ π .
