Chorochromatic map
The first known geologic map of surficial rock types was published by Jean-Étienne Guettard and Philippe Buache in 1746, showing matching formations crossing the English Channel in bands of gray.
In the early 19th Century, these kinds of maps proliferated, especially in the United Kingdom and France, including hand-painted color.
These included a variety of topics from both physical and human geography: watersheds, geology, agriculture, biogeography, and ethnicity.
With the increasing availability of chromolithography in the second half of the 19th Century, chorochromatic maps proliferated to the point that the concept of filling areas with color became almost mundane.
[5] More research has been conducted in the era of geographic information science (starting in the 1990s) on the underlying concepts and data models of discrete fields, notably issues of vagueness that are inherent to the spatial manifestation of categories.
Some of these classification systems are hierarchical, meaning some values are more similar to each other than others (e.g., geologic strata by age, language families).
In a Geographic information system, a discrete field may be stored in either a vector or raster format, typically chosen based on the larger context of the project.
For example, in Esri products such as ArcMap and ArcGIS Pro, the "Unique Values" type of symbology is available for both kinds of data.
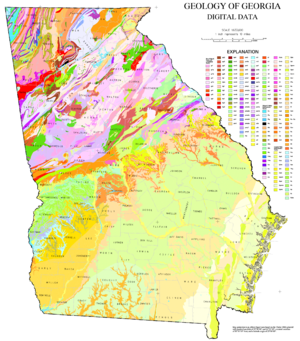
Compound chorochromatic maps represent a full discrete field, consisting of a set of regions of different categories.
[12] However, choropleth maps can be used to portray nominal data that is created by aggregating and summarizing a geographic variable within predetermined districts.
[7] Thus some variables when mapped, such as language, can suggest to the viewer a rigidity to the borders between features that may or may not exist in reality.