Fluorescence interference contrast microscopy
Fluorescence interference contrast (FLIC) microscopy is a microscopic technique developed to achieve z-resolution on the nanometer scale.
FLIC occurs whenever fluorescent objects are in the vicinity of a reflecting surface (e.g. Si wafer).
FLIC microscope is well suited to measuring the topography of a membrane that contains fluorescent probes e.g. an artificial lipid bilayer, or a living cell membrane or the structure of fluorescently labeled proteins on a surface.
The optical theory underlying FLIC was developed by Armin Lambacher and Peter Fromherz.
They derived a relationship between the observed fluorescence intensity and the distance of the fluorophore from a reflective silicon surface.
The simplest arrangement to consider is a fluorophore embedded in silicon dioxide (refractive index
is the angle of the incident light with respect to the silicon plane normal.
Fresnel coefficients give the change in amplitude between an incident and reflected wave.
can be combined to give the probability of exciting the fluorophore per unit time
It is important to note that this theory determines a proportionality relation between the measured fluorescence intensity
The fact that it is not an equality relation will have a significant effect on the experimental procedure.
A silicon wafer is typically used as the reflective surface in a FLIC experiment.
An oxide layer is then thermally grown on top of the silicon wafer to act as a spacer.
With the sample system built, all that is needed is an epifluorescence microscope and a CCD camera to make quantitative intensity measurements.
The silicon dioxide thickness is very important in making accurate FLIC measurements.
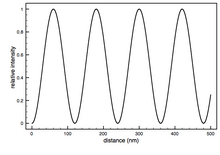
As mentioned before, the theoretical model describes the relative fluorescence intensity measured versus the fluorophore height.
The fluorophore position cannot be simply read off of a single measured FLIC curve.
For a sample with fluorophore height in the range of 10 nm, oxide thickness around 50 nm would be best because the FLIC intensity curve is steepest here and would produce the greatest contrast between fluorophore heights.
Oxide thickness above a few hundred nanometers could be problematic because the curve begins to get smeared out by polychromatic light and a range of incident angles.
(~1.0) gives good lateral resolution which is best if the goal is to determine long range topography.
(~0.001), on the other hand, provides accurate z-height measurement to determine the height of a fluorescently labeled molecule in a system.
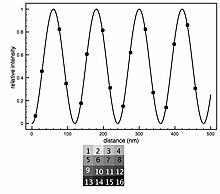
The basic analysis involves fitting the intensity data with the theoretical model allowing the distance of the fluorophore above the oxide surface (
The FLIC curves shift to the left as the distance of the fluorophore above the oxide increases.
Normally an amplitude factor (a) and a constant additive term for the background (b) are included.
The amplitude factor scales the relative model intensity and the constant background shifts the curve up or down to account for fluorescence coming from out of focus areas, such as the top side of a cell.
The other parameters entering the optical theory, such as different indices of refraction, layer thicknesses and light wavelengths, are assumed constant with some uncertainty.
A FLIC chip may be made with oxide terraces of 9 or 16 different heights arranged in blocks.
After a fluorescence image is captured, each 9 or 16 terrace block yields a separate FLIC curve that defines a unique
comes from two sources: the error in fitting of the optical theory to the data and the uncertainty in the thickness of the oxide layer.
Systematic error comes from three sources: the measurement of the oxide thickness (usually by ellipsometer), the fluorescence intensity measurement with the CCD, and the uncertainty in the parameters used in the optical theory.