Hurricane Andres (2009)
Within 36 hours, the storm rapidly degenerated, having most of the convection being displaced by high wind shear, becoming a non-tropical trough during the afternoon of June 24.
Hurricane Andres originated out of a tropical wave that entered the eastern Pacific basin on June 16 after crossing Central America.
[2] By June 20, the wave spawned an area of low pressure roughly 175 mi (280 km) south-southeast of Acapulco, Mexico.
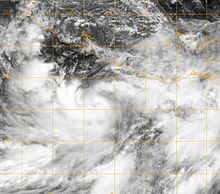
[1][4] By the morning of June 22, very deep thunderstorm activity existed near the center, and the overall convective pattern had become more symmetric in nature.
[5] Favorable conditions, warm sea surface temperatures, allowed Andres to gradually intensify as it tracked near the Mexican coastline.
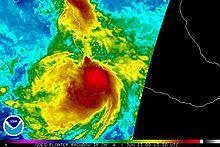
[1] Early the next day, the center of circulation became embedded within a central dense overcast[8] and Andres intensified into a hurricane, the first of the season, around 0600 UTC.
[9] By the evening of June 23, Andres weakened to a tropical storm due to increasing wind shear, decreasing sea surface temperatures as it entered a more stable air mass.
[10] By 1200 UTC on June 24, the storm weakened into a tropical depression while situated roughly 100 mi (155 km) west of Cabo Corrientes, Jalisco.
[16] Rough seas led to the drowning of a fishermen in a lagoon near Tecpan de Galeana, Guerrero,[1] while flooding caused by the storm prompted the evacuation of 200 people; 14 shelters were opened to accommodate the evacuees.
[19] The Civil Protection System prepared relief materials, consisting of 600 blankets, 600 mattresses and 700 cots to house people in emergency shelters.
[21] In the community of La Soledad, heavy rains accompanied by hail hit 38 homes, crops and coffee grounds cultivation in the region.
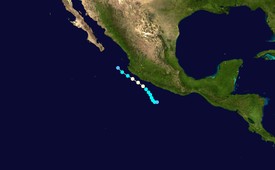
Tropical storm (39–73 mph, 63–118 km/h)
Category 1 (74–95 mph, 119–153 km/h)
Category 2 (96–110 mph, 154–177 km/h)
Category 3 (111–129 mph, 178–208 km/h)
Category 4 (130–156 mph, 209–251 km/h)
Category 5 (≥157 mph, ≥252 km/h)
Unknown