Meteorological history of Hurricane Matthew
The system originated from a tropical wave that emerged off the west coast of Africa on September 22, and ultimately dissipated as an extratropical cyclone near Atlantic Canada on October 10.
The cyclone was responsible for roughly 600 deaths (with initial reports of up to 1,600), making Matthew the deadliest since Stan in 2005, and caused $15.1 billion (2016 USD) in damages, which made it the costliest since Sandy in 2012.
On September 22–23, a vigorous tropical wave, embedded within the monsoon trough, exited the west coast of Africa over the Atlantic Ocean near Guinea Bissau.
[4] Located unusually close to the equator, roughly 8–10°N,[1] the system was unable to acquire significant spin via the Coriolis force and struggled to develop as it moved rapidly west at 25–30 mph (40–48 km/h).
[7] With environmental conditions favoring slow development, thunderstorm activity increased along the wave on September 25,[8] which organized more during the subsequent days while approaching the Lesser Antilles.
[11] Another hurricane hunters flight on September 28 confirmed that a closed circulation developed, recorded surface winds of 58 mph (93 km/h), and observed hurricane-force gusts at the plane's level.
[1] Steered by a strong ridge over the Western Atlantic, Matthew traveled generally west with its center passing between the islands of St. Lucia and St. Vincent before emerging over the Caribbean Sea.
[17] By 18:00 UTC on September 29, data from aircraft reconnaissance revealed Matthew to have intensified into a hurricane—having sustained winds of at least 74 mph (119 km/h)—by which time the cyclone was located 190 mi (300 km) northeast of Curaçao.
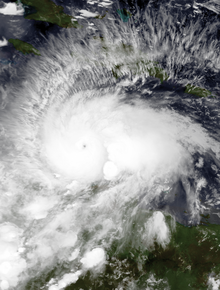
[20] The hurricane's satellite presentation had markedly improved,[20] with cloud tops colder than −112 °F (−80 °C) in the central dense overcast surrounding a 6 mi (9.7 km) wide eye.
[1][21] Throughout the explosive intensification period, Matthew was embedded within a broad region of 21–25 mph (34–40 km/h) west-southwesterly wind shear, as calculated by the Statistical Hurricane Intensity Prediction Scheme (SHIPS) model using a 1,000 km (600 mi) aerial grid.
Reduction to a 400 km (200 mi) aerial grid in post-storm analysis revealed significantly lower wind shear at a localized level, calculated at 12–17 mph (19–27 km/h).
[21] Clouds later obscured Matthew's eye and its central pressure rose; however, its core remained incredibly small with an average radius of maximum wind of 8 mi (13 km).
[33] After briefly remaining stationary, Matthew slowly progressed to the north-northwest early on October 2 between a trough over the Gulf of Mexico and the ridge over the western Atlantic.
By 00:00 UTC on October 5, the eye of Matthew made landfall on the eastern tip of the Cuban peninsula near the town of Juaco with winds of 130 mph (210 km/h) and a central pressure near 949 mbar (28.02 inHg).
[1] Some further weakening occurred as it traversed through the Bahamas – which had previously been pounded by Hurricane Joaquin a little over a year prior at a similar intensity – but began to reintensify, with cooling cloud tops around an eye that was trying to reform.
[44][1] By late on October 7, as Matthew advanced towards the Carolinas, paralleling the coast of Georgia, the southern eyewall of the hurricane had broken apart, as seen from Doppler radar, subsequently, the associated satellite presentation had started to become elongated.
[note 3][47][1] While the hurricane traversed the Bahamas on October 5, the complex interaction between Matthew, a trough moving off the East Coast, a ridge over New England, and then Tropical Storm Nicole near Bermuda led to unusually high uncertainty in its future track.
[48] For the loop to have taken place, a trough moving toward the Eastern United States, associated with the jet stream, would have to "miss" Matthew and not cause the hurricane to accelerate out to sea.
[49][50] The GFS model in particular consistently showed this scenario for several days, even taking the remnants of Matthew into the Gulf of Mexico and later Louisiana—a track reminiscent of Hurricane Betsy in 1965.
[51] Barry Keim, a climatologist at Louisiana State University, noted a large margin of error with this potential track while forecasters at the NHC declined commentary to keep focus on the immediate landfall threat.
[52] Jerry Combs of the Melbourne, Florida, National Weather Service Office reiterated the position of the NHC: "Right now, we're not even worried about [the potential loop].
"[53] By the time Matthew had made landfall in South Carolina early on October 8, the cyclone had begun to lose its tropical characteristics as it became embedded into the mid-latitude westerlies.