While the concepts guiding reaction progress kinetic analysis are not new, the process was formalized by Professor Donna Blackmond (currently at Scripps Research Institute) in the late 1990s and has since seen increasingly widespread use.
As the mechanism can vary depending on the relative and absolute concentrations of the species involved, this approach obtains results that are much more representative of reaction behavior under commonly utilized conditions than do traditional tactics.
Furthermore, information obtained by observation of the reaction over time may provide insight regarding unexpected behavior such as induction periods, catalyst deactivation, or changes in mechanism.
Regardless of the technique implemented, it is generally advantageous to confirm the validity in the system of interest by monitoring with an additional independent method.
[2] NMR spectroscopy is often the method of choice for monitoring reaction progress, where substrate consumption and/or product formation may be observed over time from the change of peak integration relative to a non-reactive standard.
From the concentration data, the rate of reaction over time may be obtained by taking the derivative of a polynomial fit to the experimental curve.
)[4] In situ infrared spectroscopy may be used to monitor the course of a reaction, provided a reagent or product shows distinctive absorbance in the IR spectral region.
The rate of reactant consumption and/or product formation may be abstracted from the change of absorbance over time (by application of Beers' Law).
Even when reactant and product spectra display some degree of overlap, modern instrumentation software is generally able to accurately deconvolute the relative contributions provided there is a dramatic change in the absolute absorbance of the peak of interest over time.
[2] From these data, the starting material or product concentration over time may be obtained by simply taking the integral of a polynomial fit to the experimental curve.
The rate of reactant consumption and/or product formation may be abstracted from the change of absorbance over time (by application of Beer's Law), again leading to classification as an integral technique.
From these data, the starting material or product concentration over time may be obtained by simply taking the integral of a polynomial fit to the experimental curve.
[2] While these plots often provide a visually compelling demonstration of basic kinetic trends, differential methods are generally superior for extracting numerical rate constants.
[15] In the case of the steady-state conditions described above, the catalyst resting state is the unbound form (because the substrate-bound intermediate is, by definition, only present at a minimal concentration.
)[16] Under pre-equilibrium conditions, the catalyst and substrate undergo rapid and reversible association prior to a relatively slow step leading to product formation and release.
Multiple mechanisms may be present to access the product, in which case the order in catalyst or substrate may change depending on the conditions or point in the reaction.
[3][11] The variable parameter of greatest interest in reaction progress kinetic analysis is the excess (e) of one substrate over another, given in units of molarity.
One would expect the reaction progress, described by the rate vs. substrate concentration plots detailed above, to map directly onto each other from that interception point onward.
[2][3] A perfect overlay of multiple experiments with the same-excess but different initial substrate loadings suggests that no changes in the active substrate/catalyst concentration occur over the course of the reaction.
The failure of the plots to overlay is generally indicative of catalyst activation, deactivation, or product inhibition under the reaction conditions.
Product inhibition has long been known to influence catalyst efficiency of many systems, and in the case of same-excess experiments, it prevents the intercepting and parent reactions from overlaying.
Same-excess experiments probing catalyst deactivation and product inhibition are among the most widely used applications of reaction progress kinetic analysis.
Graphical rate laws do, however, maintain that intuitive presentation of linearized data, such that visual inspection of the plot can provide mechanistic insight regarding the reaction at hand.
For example, in the simple cycle discussed with regard to different-excess experiments a plot of v/[A] vs. [B] and its twin v/[B] vs. [A] can provide intuitive insight about the order of each of the reagents.
Non-overlaying results of these graphical rate laws are possible and are indicative of higher order dependence on the substrates probed.
Furthermore, while the presentation of graphical rate laws may at times be considered a visually simplified way to present complex kinetic data, fitting the raw kinetic data for analysis by differential or other rigorous numerical methods is necessary to extract accurate and quantitative rate constants and reaction orders.
a)
The concentrations of substrate and/or product are monitored over time by methods such as
in situ
IR, UV-vis, or NMR or may be obtained by taking the integral of (c).
b)
Presenting the fractional conversion of substrate provides a normalization of the data in (a).
c)
The rate of reaction progress (product formation) is monitored over time by methods such as reaction progress calorimetry or may be obtained by taking the first derivative of (a).
d)
Describing the rate of reaction progress with respect to consumption of starting material spreads the data into a more informative distribution than observed in (c). Note that reaction progress is read from right (maximum substrate concentration) to left (no remaining substrate) in (d).
a)
The simplest case of steady state kinetics involves one substrate reversibly forming an intermediate complex (to which the
steady-state approximation
is applied) with the catalyst, followed by irreversible product formation.
b)
In a more complex example, two substrates bind the catalyst to sequentially form two intermediates (and the
steady-state approximation
is applied to both) followed by irreversible product formation. Note that because I2 is kinetically invisible, this is the same as for the case where I1 goes directly to free product and catalyst. For both (a) and (b),
i)
describes the catalytic cycle with relevant rate constants and concentrations,
ii)
displays the concentration of product and reactant over the course of the reaction,
iii)
describes the rate of the reaction as substrate is consumed from right to left, and
iv)
shows that the catalyst resting state is entirely the free catalyst while the concentrations of the intermediates remain small and approximately unchanging as substrate is consumed from right to left.
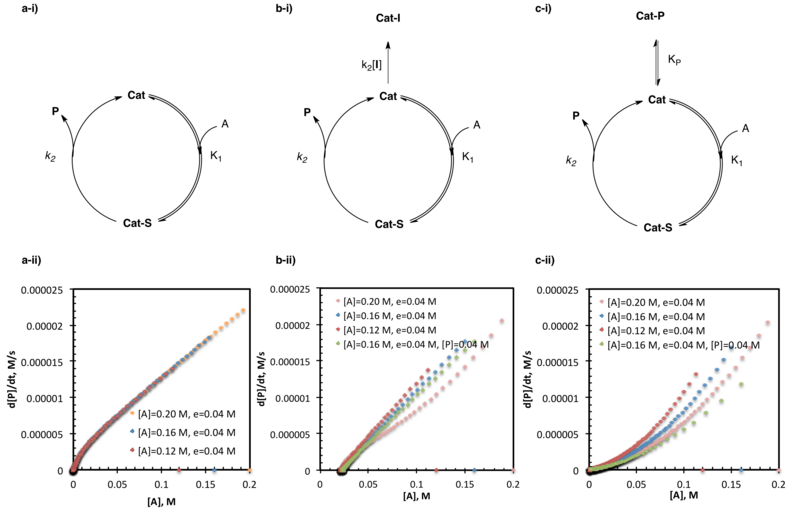
a)
The simplest case of pre-equilibrium kinetics involves one substrate
rapidly
and reversibly forming an intermediate complex with the catalyst, followed by irreversible product formation.
b)
In a more complex example, two substrates sequentially bind the catalyst
rapidly
and reversibly followed by irreversible product formation. For both (a) and (b),
i)
describes the catalytic cycle with relevant rate constants and concentrations,
ii)
displays the concentration of product and reactant over the course of the reaction,
iii)
describes the rate of the reaction as substrate is consumed from right to left, and
iv)
shows that the catalyst resting state is an equilibrium distribution of free catalyst and intermediates where the distribution is shifted increasingly toward free catalyst as substrate is consumed from right to left.
a)
The simplest case of saturation kinetics extends from the pre-equilibrium situation in which rapid substrate complexation with a catalyst is followed by slow formation of the product.
b)
The straight portion of the graph for substrate concentration over time is indicative of a zero-order dependence on substrate for most of the reaction, but the curve at low [A] is indicative of a change to (in this case) a first-order dependence on [A].
c)
Saturation of the catalyst is apparent at high concentrations of substrate (where the rate has no dependence on [A], but as substrate is consumed, the reaction rate drops with a first-order dependence on [A] to pass through the origin.
d)
The catalyst resting state also changes, where it exists almost entirely as the substrate-bound complex, Cat–A, at high [A] but increasingly as the free catalyst, Cat, as [A] decreases over the course of the reaction.
The rate of product formation in the cyanosilylation of ketone, A, shows a slight non-linear dependence on catalyst loading at high catalyst concentrations.
a)
This observation, among others, is accounted for by the reversible formation of inactive catalyst complexes.
b)
Similar behavior at multiple conversion points is consistent with one dominant mechanism operating over the entire course of the reaction.
[
18
]
a)
According to the proposed mechanism for the palladium-catalyzed amination of aryl halides, an induction period will be present as the active catalyst is generated from an inactive pre-catalyst (where L =
BINAP
).
b)
This induction period may be observed at early conversion points, before the catalyzed reaction reaches its maximum rate. In same-excess experiments, this will manifest itself in the non-overlying portions of curves designed to intercept the original reaction at intermediate conversion points. Here, a same-excess (
e
= 0.60 M) of [ArX] relative to [HNR
2
] and [MOR] is utilized for each of the curves.
Reaction progress kinetic analysis can distinguish
a)
uninhibited catalysis
b)
irreversible catalyst death, and
c)
product inhibition by a series of same-excess experiments. Lack of overlay between rate vs. substrate concentration for multiple trials of the same reaction with the same-excess but different initial concentrations is indicative of product inhibition or catalyst death. The two may be distinguished where overlay of same-excess experiments with added product is indicative of product inhibition, where lack of overlay is indicative of an alternative form of catalyst death.
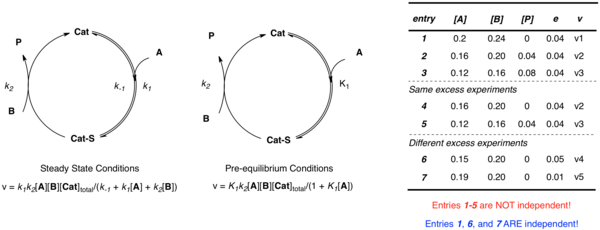
Consider the simple example where the catalyst associates with substrate A, followed by reaction with B to form product, P and free catalyst. Regardless of the approximation applied, multiple independent parameters (
k
1
,
k
−1
, and
k
2
in the case of steady-state;
k
2
and
K
1
in the case of pre-equilibrium) are required to define the system. While one could imagine constructing multiple equations to describe the unknowns at different concentrations, when the data is obtained from a same-excess experiment [A] and [B] are not independent. Multiple experiments using different values of
e
are necessary to establish multiple independent equations defining the multiple independent rate constants in terms of experimental rates and concentrations. Non-linear least squares analysis may then be employed to obtain best fit values of the unknown rate constants to those equations.
One possible sequence for establishing kinetic order by reaction progress kinetic analysis. Adapted with modification from the process proposed by Donna Blackmond