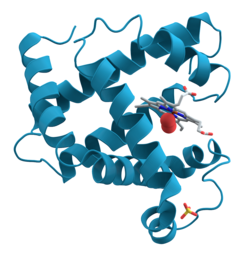
Ribbon diagram
In 1982, Arthur M. Lesk and co-workers first enabled the automatic generation of ribbon diagrams through a computational implementation that uses Protein Data Bank files as input.
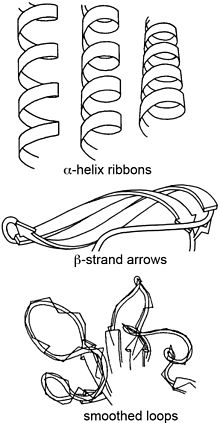
Both hand-drawn and most computer ribbons (such as those shown here) are smoothed over about four successive guide points (usually the peptide midpoint) to produce a more visually pleasing and understandable representation.
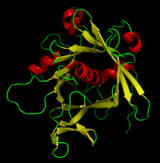
To give the right radius for helical spirals while preserving smooth β-strands, the splines can be modified by offsets proportional to local curvature, as first developed by Mike Carson for his Ribbons program[8] and later adopted by other molecular graphics software, such as the open-source Mage program for kinemage graphics[9] that produced the ribbon image at top right (other examples: 1XK8 trimer and DNA polymerase).
UCSF Chimera is a powerful molecular modeling program that also includes visualizations such as ribbons, notable especially for the ability to combine them with contoured shapes from cryo-electron microscopy data.
[12] PyMOL, by Warren DeLano,[13] is a popular and flexible molecular graphics program (based on Python) that operates in interactive mode and also produces presentation-quality 2D images for ribbon diagrams and many other representations.