Trophic coherence
[1] It is based on the concept of trophic levels used mainly in ecology,[2] but which can be defined for directed networks in general and provides a measure of hierarchical structure among nodes.
It has been related to several structural and dynamical properties of directed networks, including the prevalence of cycles[3] and network motifs,[4] ecological stability,[1] intervality,[5] and spreading processes like epidemics and neuronal avalanches.
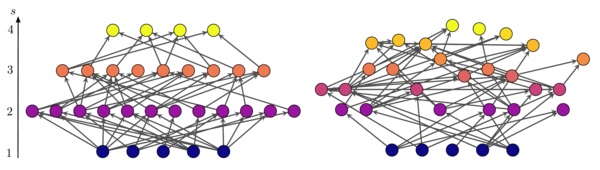
The position of the nodes on the vertical axis corresponds to their trophic level.
[6] The degree to which empirical networks are trophically coherent (or incoherent) can be investigated by comparison with a null model.
the numbers of nodes and edges), and can be shown numerically to be a good approximation for finite random networks.
measured in empirical networks reveals whether they are more or less coherent than the random expectation.
For instance, Johnson and Jones[3] find in a set of networks that food webs are significantly coherent
, and gene regulatory networks are close to the random expectation
There is as yet little understanding of the mechanisms which might lead to particular kinds of networks becoming significantly coherent or incoherent.
[3] However, in systems which present correlations between trophic level and other features of nodes, processes which tended to favour the creation of edges between nodes with particular characteristics could induce coherence or incoherence.
In the case of food webs, predators tend to specialise on consuming prey with certain biological properties (such as size, speed or behaviour) which correlate with their diet, and hence with trophic level.
[1] However, food-web models based on a niche axis do not reproduce realistic trophic coherence,[1] which may mean either that this explanation is insufficient, or that several niche dimensions need to be considered.
[8] The relation between trophic level and node function can be seen in networks other than food webs.
The figure shows a word adjacency network derived from the book Green Eggs and Ham, by Dr.
[3] The height of nodes represents their trophic levels (according here to the edge direction which is the opposite of that suggested by the arrows, which indicate the order in which words are concatenated in sentences).
The syntactic function of words is also shown with node colour.
This example illustrates how trophic coherence or incoherence might emerge from node function, and also that the trophic structure of networks provides a means of identifying node function in certain systems.
There are various ways of generating directed networks with specified trophic coherence, all based on gradually introducing new edges to the system in such a way that the probability of each new candidate edge being accepted depends on the expected trophic difference it would have.
is a random variable drawn from a Beta distribution with parameters
This way, the generalised cascade model[9][10] is recovered in the limit
[10] This algorithm, as described above, generates networks with no cycles (except for self-cycles, if the new node
In order for cycles of all lengths to be a possible, one can consider new candidate edges in which the new node
The generalised preferential preying model[6] is similar to the one described above, but has certain advantages.
In particular, it is more analytically tractable, and one can generate networks with a precise number of edges
When each enters the system, it is assigned a single in-neighbour randomly from among those already there.
Each of these candidate edges is accepted with a probability that depends on this temporary distance.
Klaise and Johnson[6] use because they find the distribution of trophic distances in several kinds of networks to be approximately normal, and this choice leads to a range of the parameter
Once all the edges have been introduced, one must recalculate the trophic levels of all nodes, since these will differ from the temporary ones originally assigned unless
As with the preferential preying model, the average incoherence parameter
The figure above shows two networks with different trophic coherence generated with this algorithm.