Van 't Hoff equation
It was proposed by Dutch chemist Jacobus Henricus van 't Hoff in 1884 in his book Études de Dynamique chimique (Studies in Dynamic Chemistry).
[1] The Van 't Hoff equation has been widely utilized to explore the changes in state functions in a thermodynamic system.
The Van 't Hoff plot, which is derived from this equation, is especially effective in estimating the change in enthalpy and entropy of a chemical reaction.
This equation is exact at any one temperature and all pressures, derived from the requirement that the Gibbs free energy of reaction be stationary in a state of chemical equilibrium.
In practice, the equation is often integrated between two temperatures under the assumption that the standard reaction enthalpy
Combining the well-known formula for the Gibbs free energy of reaction where S is the entropy of the system, with the Gibbs free energy isotherm equation:[5] we obtain Differentiation of this expression with respect to the variable T while assuming that both
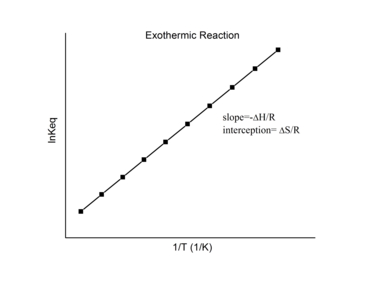
Therefore, when the range in temperature is small enough that the standard reaction enthalpy and reaction entropy are essentially constant, a plot of the natural logarithm of the equilibrium constant versus the reciprocal temperature gives a straight line.
, the temperature dependence of both terms can be described by Van t'Hoff equations as a function of T. This finds applications in the field of electrochemistry.
The data should have a linear relationship, the equation for which can be found by fitting the data using the linear form of the Van 't Hoff equation This graph is called the "Van 't Hoff plot" and is widely used to estimate the enthalpy and entropy of a chemical reaction.
[7][8] Knowing the slope and intercept from the Van 't Hoff plot, the enthalpy and entropy of a reaction can be easily obtained using The Van 't Hoff plot can be used to quickly determine the enthalpy of a chemical reaction both qualitatively and quantitatively.
This change in enthalpy can be positive or negative, leading to two major forms of the Van 't Hoff plot.
For an endothermic reaction, heat is absorbed, making the net enthalpy change positive.
For an exothermic reaction, heat is released, making the net enthalpy change negative.
Similar considerations apply to the entropy of reaction obtained from ΔrS⊖ = 1/T(ΔH⊖ + RT ln K).
Notably, when equilibrium constants are measured at three or more temperatures, values of ΔrH⊖ and ΔrS⊖ are often obtained by straight-line fitting.
[9] The expectation is that the error will be reduced by this procedure, although the assumption that the enthalpy and entropy of reaction are constant may or may not prove to be correct.
If there is significant temperature dependence in either or both quantities, it should manifest itself in nonlinear behavior in the Van 't Hoff plot; however, more than three data points would presumably be needed in order to observe this.
[11] Assume two products B and C form in a reaction: In this case, Keq can be defined as ratio of B to C rather than the equilibrium constant.
When B/C > 1, B is the favored product, and the data on the Van 't Hoff plot will be in the positive region.
When B/C < 1, C is the favored product, and the data on the Van 't Hoff plot will be in the negative region.
Using this information, a Van 't Hoff analysis can help determine the most suitable temperature for a favored product.
In 2010, a Van 't Hoff analysis was used to determine whether water preferentially forms a hydrogen bond with the C-terminus or the N-terminus of the amino acid proline.
[12] The equilibrium constant for each reaction was found at a variety of temperatures, and a Van 't Hoff plot was created.
This data alone could not conclude which site water will preferentially hydrogen-bond to, so additional experiments were used.
It was determined that at lower temperatures, the enthalpically favored species, the water hydrogen-bonded to the C-terminus, was preferred.
At higher temperatures, the entropically favored species, the water hydrogen-bonded to the N-terminus, was preferred.
Each linear fit has a different slope and intercept, which indicates different changes in enthalpy and entropy for each distinct mechanisms.
Incorporating this assumption yields an additional term c/T2 in the expression for the equilibrium constant as a function of temperature.
This effect is particularly relevant for nonionic ethoxylated surfactants[16] or polyoxypropylene–polyoxyethylene block copolymers (Poloxamers, Pluronics, Synperonics).
[17] The extended equation can be exploited for the extraction of aggregation numbers of self-assembled micelles from differential scanning calorimetric thermograms.