Zero-phonon line and phonon sideband
When the host matrix contains many chromophores, each will contribute a zero-phonon line and a phonon sideband to the absorption and emission spectra.
In an inhomogeneous distribution of chromophores, individual zero-phonon line and phonon sideband positions are therefore shifted and overlapping.
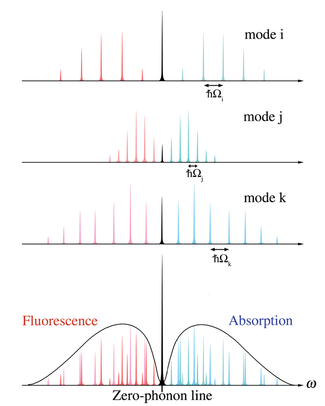
Figure 1 shows the typical line shape for electronic transitions of individual chromophores in a solid matrix.
The zero-phonon line is located at a frequency ω’ determined by the intrinsic difference in energy levels between ground and excited state as well as by the local environment.
The frequency gap Δ between the zero-phonon line and the peak of the phonon side band is determined by Franck–Condon principles.
The distribution of intensity between the zero-phonon line and the phonon side band is strongly dependent on temperature.
At room temperature there is enough thermal energy to excite many phonons and the probability of zero-phonon transition is close to zero.
Figure 2 is an energy diagram for interpreting absorption and emission with and without phonons in terms of the configurational coordinate
This is called the low temperature approximation and means that electronic transitions do not originate from any of the higher phonon levels.
The shape of the zero-phonon line is Lorentzian with a width determined by the excited state lifetime T10 according to the Heisenberg uncertainty principle.
These perturbations shift the energy of the electronic transition, introducing a temperature dependent broadening of the line width.
At higher temperatures, or when the chromophore interacts strongly with the matrix, the probability of multiphonon is high and the phonon side band approximates a Gaussian distribution.
The distribution of intensity between the zero-phonon line and the phonon sideband is characterized by the Debye-Waller factor α.
In the case of the optical zero-phonon line, the position of the chromophore is the physical parameter that may be perturbed, whereas in the gamma transition, the momenta of the atoms may be changed.
More technically, the key to the analogy is the symmetry between position and momentum in the Hamiltonian of the quantum harmonic oscillator.