Correlogram
In the analysis of data, a correlogram is a chart of correlation statistics.
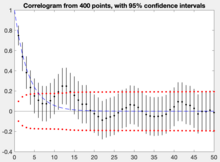
For example, in time series analysis, a plot of the sample autocorrelations
If cross-correlation is plotted, the result is called a cross-correlogram.
The correlogram is a commonly used tool for checking randomness in a data set.
In addition, correlograms are used in the model identification stage for Box–Jenkins autoregressive moving average time series models.
In multivariate analysis, correlation matrices shown as color-mapped images may also be called "correlograms" or "corrgrams".
The randomness assumption is critically important for the following three reasons: where s is the standard deviation of the data.
Although heavily used, the results from using this formula are of no value unless the randomness assumption holds.
Some sources may use the following formula for the autocovariance function: Although this definition has less bias, the (1/N) formulation has some desirable statistical properties and is the form most commonly used in the statistics literature.
In the same graph one can draw upper and lower bounds for autocorrelation with significance level
: If the autocorrelation is higher (lower) than this upper (lower) bound, the null hypothesis that there is no autocorrelation at and beyond a given lag is rejected at a significance level of
This test is an approximate one and assumes that the time-series is Gaussian.
In the above, z1−α/2 is the quantile of the normal distribution; SE is the standard error, which can be computed by Bartlett's formula for MA(ℓ) processes: In the example plotted, we can reject the null hypothesis that there is no autocorrelation between time-points which are separated by lags up to 4.
For most longer periods one cannot reject the null hypothesis of no autocorrelation.
Note that there are two distinct formulas for generating the confidence bands: 1.
If the correlogram is being used to test for randomness (i.e., there is no time dependence in the data), the following formula is recommended: where N is the sample size, z is the quantile function of the standard normal distribution and α is the significance level.
In this case, the confidence bands have fixed width that depends on the sample size.
In this case, a moving average model is assumed for the data and the following confidence bands should be generated: where k is the lag.
Correlograms are available in most general purpose statistical libraries.
Correlograms: Corrgrams: This article incorporates public domain material from the National Institute of Standards and Technology