Bagplot
A bagplot, or starburst plot,[1][2] is a method in robust statistics for visualizing two- or three-dimensional statistical data, analogous to the one-dimensional box plot.
Introduced in 1999 by Rousseuw et al., the bagplot allows one to visualize the location, spread, skewness, and outliers of a data set.
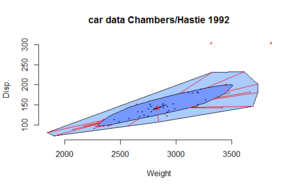
[3] The bagplot consists of three nested polygons, called the "bag", the "fence", and the "loop".
The three-dimensional version consists of an inner and outer bag.
The bagplot is invariant under affine transformations of the plane, and robust against outliers.