Bass diffusion model
It consists of a simple differential equation that describes the process of how new products get adopted in a population.
Mathematically, the basic Bass diffusion is a Riccati equation with constant coefficients equivalent to Verhulst—Pearl logistic growth.
In 1969, Frank Bass published his paper on a new product growth model for consumer durables.
[1]: 1833 [2] Prior to this, Everett Rogers published Diffusion of Innovations, a highly influential work that described the different stages of product adoption.
[3] While the Rogers model describes all four stages of the product lifecycle (Introduction, Growth, Maturity, Decline), The Bass model focuses on the first two (Introduction and Growth).
Where: Expressed as an ordinary differential equation, Sales (or new adopters)
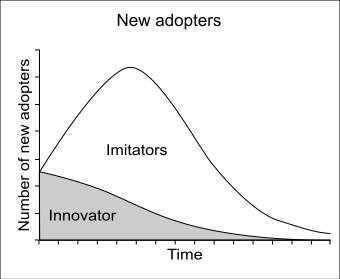
is called the coefficient of innovation, external influence or advertising effect.
is called the coefficient of imitation, internal influence or word-of-mouth effect.
The Bass diffusion model is derived by assuming that the hazard rate
, we find that the Bass diffusion model for product uptake is:
Bass found that his model fit the data for almost all product introductions, despite a wide range of managerial decision variables, e.g. pricing and advertising.
[6] This model was developed in 1994 by Frank Bass, Trichy Krishnan and Dipak Jain: where
is a function of percentage change in price and other variables Unlike the Bass model which has an analytic solution, but can also be solved numerically, the generalized bass models usually do not have analytic solutions and must be solved numerically.
Orbach (2016)[7] notes that the values of p,q are not perfectly identical for the continuous-time and discrete-time forms.
Norton and Bass extended the model in 1987 for sales of products with continuous repeat purchasing.
The Bass model is a special case of the Gamma/shifted Gompertz distribution (G/SG): Bemmaor[9] (1994) The rapid, recent (as of early 2007) growth in online social networks (and other virtual communities) has led to an increased use of the Bass diffusion model.
The Bass diffusion model is used to estimate the size and growth rate of these social networks.
The work by Christian Bauckhage and co-authors[10] shows that the Bass model provides a more pessimistic picture of the future than alternative model(s) such as the Weibull distribution and the shifted Gompertz distribution.
Negative q does not necessarily mean that adopters are disappointed and dissatisfied with their purchase.
It can fit a case wherein the benefit from a product declines as more people adopt.
For example, for a certain demand level for train commuting, reserved tickets may be sold to those who like to guarantee a seat.
While the non-cumulative sales curve with negative q is similar to those with q=0, the cumulative sales curve presents a more interesting situation: When p > -q, the market will reach 100% of its potential, eventually, as for a regular positive value of q.
However, if p < -q, at the long-range, the market will saturate at an equilibrium level –p/q of its potential.
Orbach (2022)[13] summarized the diffusion behavior at each portion of the p,q space and maps the extended (p,q) regions beyond the positive right quadrant (where diffusion is spontaneous) to other regions where diffusion faces barriers (negative p), where diffusion requires “stimuli” to start, or resistance of adopters to new members (negative q), which might stabilize the market below full adoption, occur.
The model is one of the most cited empirical generalizations in marketing; as of August 2023 the paper "A New Product Growth for Model Consumer Durables" published in Management Science had (approximately) 11352 citations in Google Scholar.
[14] This model has been widely influential in marketing and management science.
In 2004 it was selected as one of the ten most frequently cited papers in the 50-year history of Management Science.
It was subsequently reprinted in the December 2004 issue of Management Science.
However, it has been used also to forecast market acceptance of numerous consumer and industrial products and services, including tangible, non-tangible, medical,[15][16] and financial[17] products.
Sultan[18] et al. (1990) applied the Bass model to 213 product categories, mostly consumer durables (in a wide range of prices) but also to services such as motels and industrial/farming products like hybrid corn seeds.