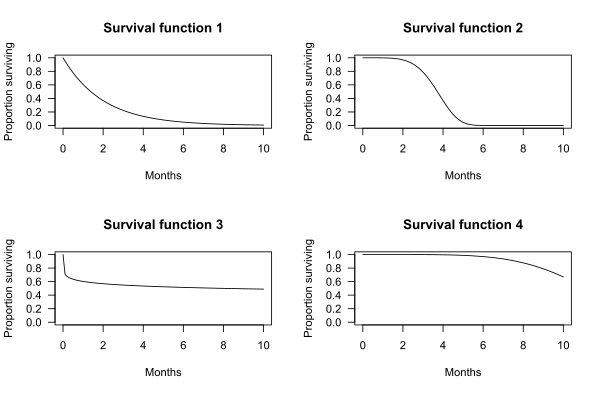
Survival function
Another useful way to display data is a graph showing the distribution of survival times of subjects.
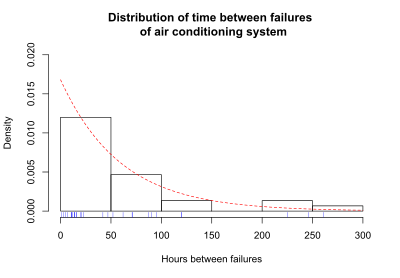
The number of hours between successive failures of an air-conditioning (AC) system were recorded.
The blue tick marks beneath the graph are the actual hours between successive AC failures.
Most survival analysis methods assume that time can take any positive value, and fT is the PDF.
If the time between observed AC failures is approximated using the exponential function, then the exponential curve gives the probability density function, fT, for AC failure times.
Another useful way to display the survival data is a graph showing the cumulative failures up to each time point.
The graph below shows the cumulative probability (or proportion) of failures at each time for the air conditioning system.
For each step there is a blue tick at the bottom of the graph indicating an observed failure time.
The smooth red line represents the exponential curve fitted to the observed data.
For the air-conditioning example, the graph of the CDF below illustrates that the probability that the time to failure is less than or equal to 100 hours is 0.81, as estimated using the exponential curve fit to the data.
Several distributions are commonly used in survival analysis, including the exponential, Weibull, gamma, normal, log-normal, and log-logistic.
The normal (Gaussian) distribution, for example, is defined by the two parameters mean and standard deviation.
For an exponential survival distribution, the probability of failure is the same in every time interval, no matter the age of the individual or device.
This fact leads to the "memoryless" property of the exponential survival distribution: the age of a subject has no effect on the probability of failure in the next time interval.
The exponential may be a good model for the lifetime of a system where parts are replaced as they fail.
[8] As Efron and Hastie [9] (p. 134) note, "If human lifetimes were exponential there wouldn't be old or young people, just lucky or unlucky ones".
A key assumption of the exponential survival function is that the hazard rate is constant.
For some diseases, such as breast cancer, the risk of recurrence is lower after 5 years – that is, the hazard rate decreases with time.
There are several other parametric survival functions that may provide a better fit to a particular data set, including normal, lognormal, log-logistic, and gamma.
The choice of parametric distribution for a particular application can be made using graphical methods or using formal tests of fit.
If an appropriate distribution is not available, or cannot be specified before a clinical trial or experiment, then non-parametric survival functions offer a useful alternative.
In these situations, the most common method to model the survival function is the non-parametric Kaplan–Meier estimator.
Periodic case (cohort) and death (and recovery) counts are statistically sufficient to make non-parametric maximum likelihood and least squares estimates of survival functions, without lifetime data.
, the expected value formula may be modified: This may be further simplified by employing integration by parts: By definition,
Therefore, we may conclude that the expected value is simply the integral of the survival function: