Biplot
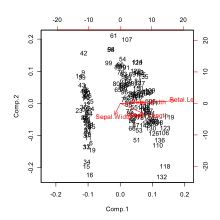
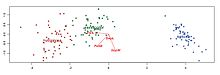
Biplots are a type of exploratory graph used in statistics, a generalization of the simple two-variable scatterplot.
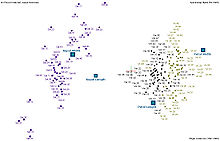
A biplot allows information on both samples and variables of a data matrix to be displayed graphically.
A generalised biplot displays information on both continuous and categorical variables.
[1] A biplot is constructed by using the singular value decomposition (SVD) to obtain a low-rank approximation to a transformed version of the data matrix X, whose n rows are the samples (also called the cases, or objects), and whose p columns are the variables.
The biplot is formed from two scatterplots that share a common set of axes and have a between-set scalar product interpretation.