Cohen's kappa
There is controversy surrounding Cohen's kappa due to the difficulty in interpreting indices of agreement.
[3][4] The seminal paper introducing kappa as a new technique was published by Jacob Cohen in the journal Educational and Psychological Measurement in 1960.
[5] Cohen's kappa measures the agreement between two raters who each classify N items into C mutually exclusive categories.
In the traditional 2 × 2 confusion matrix employed in machine learning and statistics to evaluate binary classifications, the Cohen's Kappa formula can be written as:[7] where TP are the true positives, FP are the false positives, TN are the true negatives, and FN are the false negatives.
In this case, Cohen's Kappa is equivalent to the Heidke skill score known in Meteorology.
[9] Suppose that you were analyzing data related to a group of 50 people applying for a grant.
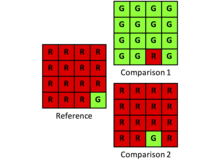
The observed proportionate agreement is: To calculate pe (the probability of random agreement) we note that: So the expected probability that both would say yes at random is: Similarly: Overall random agreement probability is the probability that they agreed on either Yes or No, i.e.: So now applying our formula for Cohen's Kappa we get: A case sometimes considered to be a problem with Cohen's Kappa occurs when comparing the Kappa calculated for two pairs of raters with the two raters in each pair having the same percentage agreement but one pair give a similar number of ratings in each class while the other pair give a very different number of ratings in each class.
However, calculating Cohen's Kappa for each: we find that it shows greater similarity between A and B in the second case, compared to the first.
is calculated by jackknife, bootstrap or the asymptotic formula described by Fleiss & Cohen [12].
If statistical significance is not a useful guide, what magnitude of kappa reflects adequate agreement?
On the other hand, Kappas are higher when codes are distributed asymmetrically by the two observers.
In contrast to probability variations, the effect of bias is greater when Kappa is small than when it is large.
Based on a simulation study, Bakeman and colleagues concluded that for fallible observers, values for kappa were lower when codes were fewer.
And, in agreement with Sim & Wrights's statement concerning prevalence, kappas were higher when codes were roughly equiprobable.
Thus Bakeman et al. concluded that "no one value of kappa can be regarded as universally acceptable.
This set of guidelines is however by no means universally accepted; Landis and Koch supplied no evidence to support it, basing it instead on personal opinion.
[17] Fleiss's[18]: 218 equally arbitrary guidelines characterize kappas over 0.75 as excellent, 0.40 to 0.75 as fair to good, and below 0.40 as poor.
Kappa assumes its theoretical maximum value of 1 only when both observers distribute codes the same, that is, when corresponding row and column sums are identical.
However, investigators must consider carefully whether Kappa's baseline agreement is relevant for the particular research question.
Kappa's baseline is frequently described as the agreement due to chance, which is only partially correct.
Thus, κ = 0 when the observed allocation is apparently random, regardless of the quantity disagreement as constrained by the marginal totals.
It is possible for Kappa's ratio to return an undefined value due to zero in the denominator.
It is more informative for researchers to report disagreement in two components, quantity and allocation.
[2]Some researchers have expressed concern over κ's tendency to take the observed categories' frequencies as givens, which can make it unreliable for measuring agreement in situations such as the diagnosis of rare diseases.
[21] Others[22][citation needed] contest the assertion that kappa "takes into account" chance agreement.
To do this effectively would require an explicit model of how chance affects rater decisions.
The so-called chance adjustment of kappa statistics supposes that, when not completely certain, raters simply guess—a very unrealistic scenario.
Moreover, some works[23] have shown how kappa statistics can lead to a wrong conclusion for unbalanced data.
Cohen's kappa and Scott's pi differ in terms of how pe is calculated.
Weight matrix cells located on the diagonal (upper-left to bottom-right) represent agreement and thus contain zeros.