Critical point (thermodynamics)
Other examples include the liquid–liquid critical points in mixtures, and the ferromagnet–paramagnet transition (Curie temperature) in the absence of an external magnetic field.
[3] In the vicinity of the critical point, the physical properties of the liquid and the vapor change dramatically, with both phases becoming even more similar.
For instance, liquid water under normal conditions is nearly incompressible, has a low thermal expansion coefficient, has a high dielectric constant, and is an excellent solvent for electrolytes.
Near the critical point, all these properties change into the exact opposite: water becomes compressible, expandable, a poor dielectric, a bad solvent for electrolytes, and mixes more readily with nonpolar gases and organic molecules.
Sometimes[ambiguous] the critical point does not manifest in most thermodynamic or mechanical properties, but is "hidden" and reveals itself in the onset of inhomogeneities in elastic moduli, marked changes in the appearance and local properties of non-affine droplets, and a sudden enhancement in defect pair concentration.
[9] The existence of a critical point was first discovered by Charles Cagniard de la Tour in 1822[10][11] and named by Dmitri Mendeleev in 1860[12][13] and Thomas Andrews in 1869.
This relationship is approximately true for many substances, but becomes increasingly inaccurate for large values of pr.
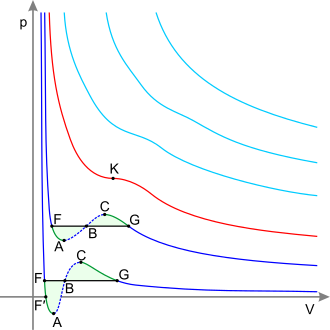
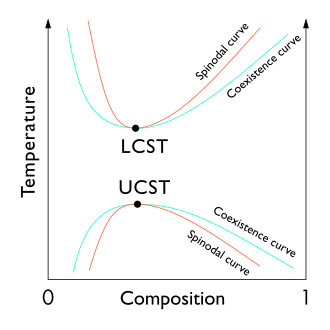
From a theoretical standpoint, the liquid–liquid critical point represents the temperature–concentration extremum of the spinodal curve (as can be seen in the figure to the right).

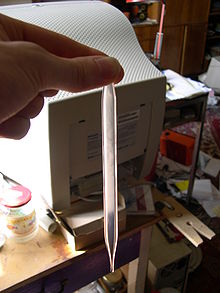
- Subcritical ethane , liquid and gas phase coexist.
- Critical point (32.17 °C, 48.72 bar), displaying critical opalescence .
- Supercritical ethane, fluid . [ 1 ]