Estimation statistics
[8][9] Starting in 1929, physicist Raymond Thayer Birge published review papers[10] in which he used weighted-averages methods to calculate estimates of physical constants, a procedure that can be seen as the precursor to modern meta-analysis.
[11] In the 1930s Jerzy Neyman published a series of papers on statistical estimation where he defined the mathematics and terminology of confidence intervals.
In the 1980s and 1990s, estimation methods were extended and refined for practical application by biostatisticians including Larry Hedges, Michael Borenstein, Doug Altman, Martin Gardner, and many others, with the development of the modern (medical) meta-analysis.
In the 1990s, editor Kenneth Rothman banned the use of p-values from the journal Epidemiology; compliance was high among authors but this did not substantially change their analytical thinking.
[16] In the 2010s, Geoff Cumming published a textbook dedicated to estimation statistics, along with software in Excel designed to teach effect-size thinking, primarily to psychologists.
[20] Also in 2013, the Uniform Requirements for Manuscripts Submitted to Biomedical Journals document made a similar recommendation: "Avoid relying solely on statistical hypothesis testing, such as P values, which fail to convey important information about effect size.
[22] In 2019, the Society for Neuroscience journal eNeuro instituted a policy recommending the use of estimation graphics as the preferred method for data presentation.
[23] And in 2022, the International Society of Physiotherapy Journal Editors recommended the use of estimation methods instead of null hypothesis statistical tests.
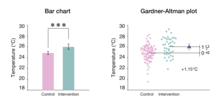
[28] The Gardner–Altman mean difference plot was first described by Martin Gardner and Doug Altman in 1986;[27] it is a statistical graph designed to display data from two independent groups.
Major types include effect sizes in the Cohen's d class of standardized metrics, and the coefficient of determination (R2) for regression analysis.