F-test
The test calculates a statistic, represented by the random variable F, and checks if it follows an F-distribution.
This check is valid if the null hypothesis is true and standard assumptions about the errors (ε) in the data hold.
[1] F-tests are frequently used to compare different statistical models and find the one that best describes the population the data came from.
The F-statistic was developed by Ronald Fisher in the 1920s as the variance ratio and was later named in his honor by George W.
[5] Most F-tests arise by considering a decomposition of the variability in a collection of data in terms of sums of squares.
The test statistic in an F-test is the ratio of two scaled sums of squares reflecting different sources of variability.
These sums of squares are constructed so that the statistic tends to be greater when the null hypothesis is not true.
The latter condition is guaranteed if the data values are independent and normally distributed with a common variance.
The formula for the one-way ANOVA F-test statistic is or The "explained variance", or "between-group variability" is where
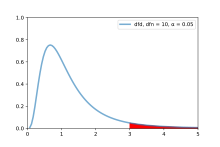
The F table serves as a reference guide containing critical F values for the distribution of the F-statistic under the assumption of a true null hypothesis.
It is designed to help determine the threshold beyond which the F statistic is expected to exceed a controlled percentage of the time (e.g., 5%) when the null hypothesis is accurate.
To locate the critical F value in the F table, one needs to utilize the respective degrees of freedom.
This involves identifying the appropriate row and column in the F table that corresponds to the significance level being tested (e.g., 5%).
The F-test in one-way analysis of variance (ANOVA) is used to assess whether the expected values of a quantitative variable within several pre-defined groups differ from each other.
The advantage of the ANOVA F-test is that we do not need to pre-specify which treatments are to be compared, and we do not need to adjust for making multiple comparisons.
One common context in this regard is that of deciding whether a model fits the data significantly better than does a naive model, in which the only explanatory term is the intercept term, so that all predicted values for the dependent variable are set equal to that variable's sample mean.
The null hypothesis is rejected if the F calculated from the data is greater than the critical value of the F-distribution for some desired false-rejection probability (e.g. 0.05).