Failure rate
In real-world applications, the failure probability of a system usually differs over time; failures occur more frequently in early-life ("burning in"), or as a system ages ("wearing out").
This is known as the bathtub curve, where the middle region is called the "useful life period".
is actually constant over time, such as within the flat region of the bathtub curve.
In many cases where MTBF is quoted, it refers only to this region; thus it cannot be used to give an accurate calculation of the average lifetime of a system, as it ignores the "burn-in" and "wear-out" regions.
A similar ratio used in the transport industries, especially in railways and trucking, is "mean distance between failures" - allowing maintenance to be scheduled based on distance travelled, rather than at regular time intervals.
: which would depend on the number of systems under study, and the conditions over the time period.
must be defined, which can be any cumulative distribution function (CDF) that gradually increases from
A concept closely-related but different[2] to instantaneous failure rate
In the many-system case, this is defined as the proportional failure rate of the systems still functioning at time
For convenience we first define the reliability (or survival function) as: then the hazard rate is simply the instantaneous failure rate, scaled by the fraction of surviving systems at time
: In the probabilistic sense, for a single system this can be interpreted as the conditional probability of failure time
, which yields[2] Thus for a collection of identical systems, only one of hazard rate
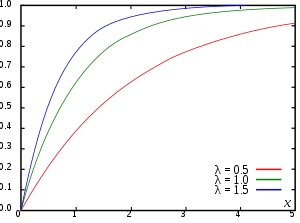
[3] There are many possible functions that could be chosen to represent failure probability density
, based on empirical or theoretical evidence, but the most common and easily-understandable choice is to set an exponential function with scaling constant
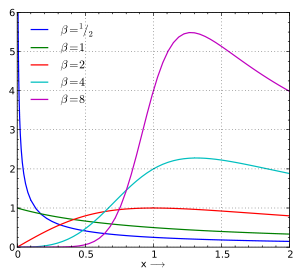
As seen in the figures above, this represents a gradually decreasing failure probability density.
This illustrates the difference in hazard rate and failure probability density - as the number of systems surviving at time
For many systems, a constant hazard function may not be a realistic approximation; the chance of failure of an individual component may depend on its age.
For example, the deterministic distribution increases hazard rate over time (for systems where wear-out is the most important factor), while the Pareto distribution decreases it (for systems where early-life failures are more common).
The predictions have been shown to be more accurate[5] than field warranty return analysis or even typical field failure analysis given that these methods depend on reports that typically do not have sufficient detail information in failure records.
This can describe, for example, the period of infant mortality in humans, or the early failure of a transistors due to manufacturing defects.
"[8][9] The hazard rate of aircraft air conditioning systems was found to have an exponentially decreasing distribution.
[10] In special processes called renewal processes, where the time to recover from failure can be neglected, the likelihood of failure remains constant with respect to time.
[clarification needed][11][12] Brown conjectured the converse, that DFR is also necessary for the inter-renewal times to be concave,[13] however it has been shown that this conjecture holds neither in the discrete case[12] nor in the continuous case.
[clarification needed][15] Note that this result only holds when the failure rate is defined for all t ⩾ 0[16] and that the converse result (coefficient of variation determining nature of failure rate) does not hold.
Failure rates can be expressed using any measure of time, but hours is the most common unit in practice.
is constant, and that the units are consistent (e.g. failures per million hours), and not expressed as a ratio or as probability densities.
This is useful to estimate the failure rate of a system when individual components or subsystems have already been tested.
[20] Combining failure or hazard rates that are time-dependent is more complicated.
Suppose it is desired to estimate the failure rate of a certain component.
A total of 7,502 component-hours of testing is performed, and 6 failures are recorded.