Genetic linkage
Genetic linkage is the tendency of DNA sequences that are close together on a chromosome to be inherited together during the meiosis phase of sexual reproduction.
[1] Genetic linkage is the most prominent exception to Gregor Mendel's Law of Independent Assortment.
In 1905, the British geneticists William Bateson, Edith Rebecca Saunders and Reginald Punnett cross-bred pea plants in experiments similar to Mendel's.
The recombination frequency is more difficult to compute in an F2 cross than a backcross,[4] but the lack of fit between observed and expected numbers of progeny in the above table indicate it is less than 50%.
[citation needed] The understanding of linkage was expanded by the work of Thomas Hunt Morgan.
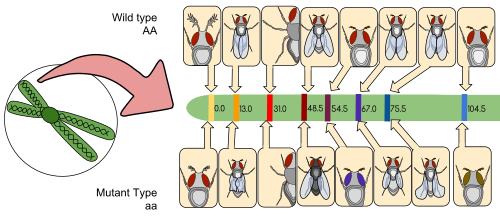
[citation needed] A linkage map (also known as a genetic map) is a table for a species or experimental population that shows the position of its known genes or genetic markers relative to each other in terms of recombination frequency, rather than a specific physical distance along each chromosome.
Linkage maps were first developed by Alfred Sturtevant, a student of Thomas Hunt Morgan.
Historically, the markers originally used were detectable phenotypes (enzyme production, eye colour) derived from coding DNA sequences; eventually, confirmed or assumed noncoding DNA sequences such as microsatellites or those generating restriction fragment length polymorphisms (RFLPs) have been used.
[citation needed] Linkage analysis is a genetic method that searches for chromosomal segments that cosegregate with the ailment phenotype through families.
Non-parametric linkage analysis, in turn, studies the probability of an allele being identical by descent with itself.
[citation needed] The LOD score (logarithm (base 10) of odds), developed by Newton Morton,[8] is a statistical test often used for linkage analysis in human, animal, and plant populations.
[10] Linkage analysis has a number of methodological and theoretical limitations that can significantly increase the type-1 error rate and reduce the power to map human quantitative trait loci (QTL).
As the likelihood of a double crossover increases one could systematically underestimate the genetic distance between two loci, unless one used an appropriate mathematical model.
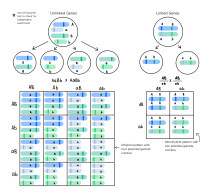
Crossing these homozygous parental strains will result in F1 generation offspring that are double heterozygotes with genotype AaBb.
[citation needed] As an example of linkage, consider the classic experiment by William Bateson and Reginald Punnett.
The recombination frequency is more difficult to compute in an F2 cross than a backcross,[4] but the lack of fit between observed and expected numbers of progeny in the above table indicate it is less than 50%.
[citation needed] The progeny in this case received two dominant alleles linked on one chromosome (referred to as coupling or cis arrangement).
While such a problem may not seem likely from this example, unfavourable repulsion linkages do appear when breeding for disease resistance in some crops.
[citation needed] However, it is important to note that recombination frequency tends to underestimate the distance between two linked genes.
[16] In the early 1950s the prevailing view was that the genes in a chromosome are discrete entities, indivisible by genetic recombination and arranged like beads on a string.
[17][18] This result provided evidence for the key idea that the gene has a linear structure equivalent to a length of DNA with many sites that can independently mutate.
Although not strictly additive, a systematic relationship was observed[20] that likely reflects the underlying molecular mechanism of genetic recombination.
While recombination of chromosomes is an essential process during meiosis, there is a large range of frequency of cross overs across organisms and within species.
[21] Mutations in genes that encode proteins involved in the processing of DNA often affect recombination frequency.
In bacteriophage T4, mutations that reduce expression of the replicative DNA polymerase [gene product 43 (gp43)] increase recombination (decrease linkage) several fold.
[27] With very large pedigrees or with very dense genetic marker data, such as from whole-genome sequencing, it is possible to precisely locate recombinations.