Graphical model
Graphical models are commonly used in probability theory, statistics—particularly Bayesian statistics—and machine learning.
Generally, probabilistic graphical models use a graph-based representation as the foundation for encoding a distribution over a multi-dimensional space and a graph that is a compact or factorized representation of a set of independences that hold in the specific distribution.
Two branches of graphical representations of distributions are commonly used, namely, Bayesian networks and Markov random fields.
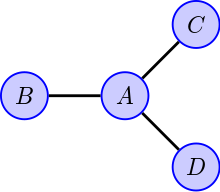
[1] The undirected graph shown may have one of several interpretations; the common feature is that the presence of an edge implies some sort of dependence between the corresponding random variables.
Equivalently (in this case), the joint probability distribution can be factorized as: for some non-negative functions
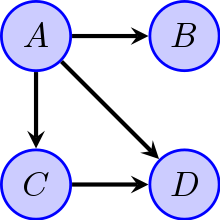
For example, in the directed acyclic graph shown in the Figure this factorization would be Any two nodes are conditionally independent given the values of their parents.
The particular graph shown suggests a joint probability density that factors as but other interpretations are possible.
[2] The framework of the models, which provides algorithms for discovering and analyzing structure in complex distributions to describe them succinctly and extract the unstructured information, allows them to be constructed and utilized effectively.
[1] Applications of graphical models include causal inference, information extraction, speech recognition, computer vision, decoding of low-density parity-check codes, modeling of gene regulatory networks, gene finding and diagnosis of diseases, and graphical models for protein structure.