Mean
A mean is a quantity representing the "center" of a collection of numbers and is intermediate to the extreme values of the set of numbers.
[1] There are several kinds of means (or "measures of central tendency") in mathematics, especially in statistics.
The arithmetic mean of a set of numbers x1, x2, ..., xn is typically denoted using an overhead bar,
[note 1] If the numbers are from observing a sample of a larger group, the arithmetic mean is termed the sample mean (
) to distinguish it from the group mean (or expected value) of the underlying distribution, denoted
[note 2][3] Outside probability and statistics, a wide range of other notions of mean are often used in geometry and mathematical analysis; examples are given below.
These means were studied with proportions by Pythagoreans and later generations of Greek mathematicians[4] because of their importance in geometry and music.
The arithmetic mean (or simply mean or average) of a list of numbers, is the sum of all of the numbers divided by their count.
For example, the arithmetic mean of five values: 4, 36, 45, 50, 75 is: The geometric mean is an average that is useful for sets of positive numbers, that are interpreted according to their product (as is the case with rates of growth) and not their sum (as is the case with the arithmetic mean): For example, the geometric mean of five values: 4, 36, 45, 50, 75 is: The harmonic mean is an average which is useful for sets of numbers which are defined in relation to some unit, as in the case of speed (i.e., distance per unit of time): For example, the harmonic mean of the five values: 4, 36, 45, 50, 75 is If we have five pumps that can empty a tank of a certain size in respectively 4, 36, 45, 50, and 75 minutes, then the harmonic mean of
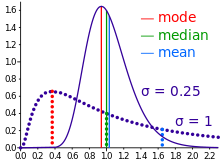
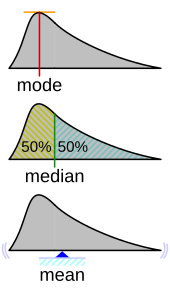
In descriptive statistics, the mean may be confused with the median, mode or mid-range, as any of these may incorrectly be called an "average" (more formally, a measure of central tendency).
While the median and mode are often more intuitive measures for such skewed data, many skewed distributions are in fact best described by their mean, including the exponential and Poisson distributions.
[6] In all cases, including those in which the distribution is neither discrete nor continuous, the mean is the Lebesgue integral of the random variable with respect to its probability measure.
It is defined for a set of n positive numbers xi by
[1] By choosing different values for the parameter m, the following types of means are obtained: This can be generalized further as the generalized f-mean and again a suitable choice of an invertible f will give The weighted arithmetic mean (or weighted average) is used if one wants to combine average values from different sized samples of the same population: Where
In other applications, they represent a measure for the reliability of the influence upon the mean by the respective values.
Sometimes, a set of numbers might contain outliers (i.e., data values which are much lower or much higher than the others).
Often, outliers are erroneous data caused by artifacts.
It involves discarding given parts of the data at the top or the bottom end, typically an equal amount at each end and then taking the arithmetic mean of the remaining data.
It is simply the arithmetic mean after removing the lowest and the highest quarter of values.
assuming the values have been ordered, so is simply a specific example of a weighted mean for a specific set of weights.
In some circumstances, mathematicians may calculate a mean of an infinite (or even an uncountable) set of values.
Intuitively, a mean of a function can be thought of as calculating the area under a section of a curve, and then dividing by the length of that section.
This can be done crudely by counting squares on graph paper, or more precisely by integration.
But the mean may be finite even if the function itself tends to infinity at some points.
Angles, times of day, and other cyclical quantities require modular arithmetic to add and otherwise combine numbers.
You can do this by adjusting the values before averaging, or by using a specialized approach for the mean of circular quantities.
The Fréchet mean gives a manner for determining the "center" of a mass distribution on a surface or, more generally, Riemannian manifold.
Unlike many other means, the Fréchet mean is defined on a space whose elements cannot necessarily be added together or multiplied by scalars.
In geometry, there are thousands of different definitions for the center of a triangle that can all be interpreted as the mean of a triangular set of points in the plane.
[7] This is an approximation to the mean for a moderately skewed distribution.
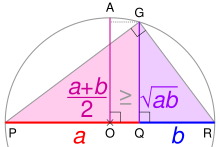
PR is the diameter of a circle centered on O; its radius AO is the arithmetic mean of a and b . Using the geometric mean theorem , triangle PGR's altitude GQ is the geometric mean . For any ratio a : b , AO ≥ GQ.