Nautical chart
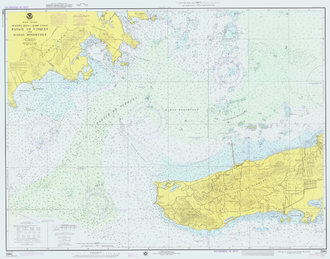
Depending on the scale of the chart, it may show depths of water (bathymetry) and heights of land (topography), natural features of the seabed, details of the coastline, navigational hazards, locations of natural and human-made aids to navigation, information on tides and currents, local details of the Earth's magnetic field, and human-made structures such as harbours, buildings, and bridges.
Nautical charts are essential tools for marine navigation; many countries require vessels, especially commercial ships, to carry them.
This ensures that difficult to find projections, such as masts, do not present a danger to vessels navigating over the obstruction.
Many hydrographic offices provide regular, sometimes weekly, manual updates of their charts through their sales agents.
There are also commercially published charts, some of which may carry additional information of particular interest, e.g. for yacht skippers.
The nature of a waterway depicted by a chart may change, and artificial aids to navigation may be altered at short notice.
This electronic publication is published on a monthly basis and can be downloaded from the Notices to Mariners (NOTMAR) Web site.
The information in the Notice to Mariners is formatted to simplify the correction of paper charts and navigational publications.
In 1973 the cargo ship MV Muirfield (a merchant vessel named after Muirfield, Scotland) struck an unknown object in the Indian Ocean in waters charted at a depth of greater than 5,000 metres (16,404 ft), resulting in extensive damage to her keel.
A similar incident involving a passenger ship occurred in 1992 when the Cunard liner Queen Elizabeth 2 struck a submerged rock off Block Island in the Atlantic Ocean.
[2] In November 1999, the semi-submersible, heavy-lift ship Mighty Servant 2 capsized and sank after hitting an uncharted single underwater isolated pinnacle of granite off Indonesia.
[3] More recently, in 2005 the submarine USS San Francisco ran into an uncharted seamount (sea mountain) about 560 kilometres (350 statute miles) south of Guam at a speed of 35 knots (40.3 mph; 64.8 km/h), sustaining serious damage and killing one seaman.
In September 2006 the jack-up barge Octopus ran aground on an uncharted sea mount within the Orkney Islands (United Kingdom) while being towed by the tug Harold.
£1M worth of damage was caused to the barge and delayed work on the installation of a tidal energy generator prototype.
NOAA uses the polyconic projection for some of its charts of the Great Lakes, at both large and small scales.
Distances in nautical miles can therefore be measured on the latitude gradations printed on the side of the chart.
[6] Conventional nautical charts are printed on large sheets of paper at a variety of scales.
Mariners will generally carry many charts to provide sufficient detail for the areas they might need to visit.
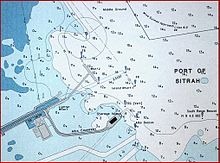
Some symbols describe the sea bed with information such as its depth, materials as well as possible navigational hazards such as shipwrecks.