Partial correlation
In probability theory and statistics, partial correlation measures the degree of association between two random variables, with the effect of a set of controlling random variables removed.
This misleading information can be avoided by controlling for the confounding variable, which is done by computing the partial correlation coefficient.
This is precisely the motivation for including other right-side variables in a multiple regression; but while multiple regression gives unbiased results for the effect size, it does not give a numerical value of a measure of the strength of the relationship between the two variables of interest.
Failing to control for wealth when computing a correlation coefficient between consumption and income would give a misleading result, since income might be numerically related to wealth which in turn might be numerically related to consumption; a measured correlation between consumption and income might actually be contaminated by these other correlations.
The partial correlation coincides with the conditional correlation if the random variables are jointly distributed as the multivariate normal, other elliptical, multivariate hypergeometric, multivariate negative hypergeometric, multinomial, or Dirichlet distribution, but not in general otherwise.
[1] Formally, the partial correlation between X and Y given a set of n controlling variables Z = {Z1, Z2, ..., Zn}, written ρXY·Z, is the correlation between the residuals eX and eY resulting from the linear regression of X with Z and of Y with Z, respectively.
The coefficient of alienation, and its relation with joint variance through correlation are available in Guilford (1973, pp. 344–345).
[2] A simple way to compute the sample partial correlation for some data is to solve the two associated linear regression problems and calculate the correlation between the residuals.
observations from some joint probability distribution over real random variables X, Y, and Z, with zi having been augmented with a 1 to allow for a constant term in the regression.
The residuals are then and the sample partial correlation is then given by the usual formula for sample correlation, but between these new derived values: In the first expression the three terms after minus signs all equal 0 since each contains the sum of residuals from an ordinary least squares regression.
Simulation and other details are in Vinod (2017) "Generalized correlation and kernel causality with applications in development economics," Communications in Statistics - Simulation and Computation, vol.
It can be computationally expensive to solve the linear regression problems.
that[3] Naïvely implementing this computation as a recursive algorithm yields an exponential time complexity.
However, this computation has the overlapping subproblems property, such that using dynamic programming or simply caching the results of the recursive calls yields a complexity of
Note in the case where Z is a single variable, this reduces to:[citation needed] The partial correlation can also be written in terms of the joint precision matrix.
Note that only a single matrix inversion is required to give all the partial correlations between pairs of variables in
are the coefficients for linear regression fit; that is, Write the joint covariance matrix for the vector
Then the standard formula for linear regression gives Hence, the residuals can be written as Note that
Computing the covariance now gives Next, write the precision matrix
in a similar block form: Then, by Schur's formula for block-matrix inversion, The entries of the right-hand-side matrix are precisely the covariances previously computed in (2), giving Using the formula for the inverse of a 2×2 matrix gives So indeed, the partial correlation is as claimed in (1).
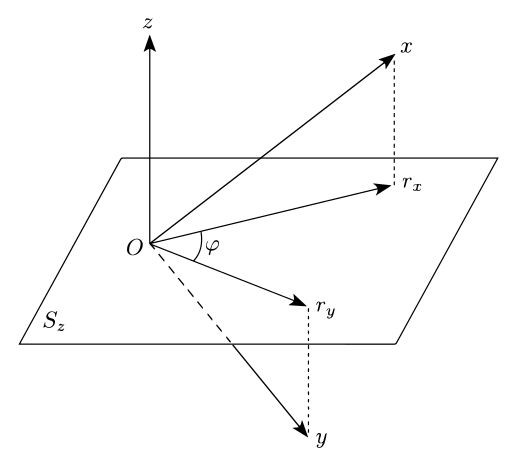
It can be shown that the residuals eX,i coming from the linear regression of X on Z, if also considered as an N-dimensional vector eX (denoted rX in the accompanying graph), have a zero scalar product with the vector z generated by Z.
This means that the residuals vector lies on an (N–1)-dimensional hyperplane Sz that is perpendicular to z.
The desired partial correlation is then the cosine of the angle φ between the projections eX and eY of x and y, respectively, onto the hyperplane perpendicular to z.[4]: ch.
7 With the assumption that all involved variables are multivariate Gaussian, the partial correlation ρXY·Z is zero if and only if X is conditionally independent from Y given Z.
This z-transform is approximate, and the actual distribution of the sample (partial) correlation coefficient is not straightforward.
[6] The semipartial (or part) correlation statistic is similar to the partial correlation statistic; both compare variations of two variables after certain factors are controlled for.
"[8] Conversely, it is less theoretically useful because it is less precise about the role of the unique contribution of the independent variable.
The reason is this: Suppose the correlation of X with Z has been removed from X, giving the residual vector ex .
In time series analysis, the partial autocorrelation function (sometimes "partial correlation function") of a time series is defined, for lag
, as[citation needed] This function is used to determine the appropriate lag length for an autoregression.