Probability distribution
More commonly, probability distributions are used to compare the relative occurrence of many different random values.
For example, the sample space of a coin flip could be Ω = { "heads", "tails" } .
To define probability distributions for the specific case of random variables (so the sample space can be seen as a numeric set), it is common to distinguish between discrete and absolutely continuous random variables.
In contrast, when a random variable takes values from a continuum then by convention, any individual outcome is assigned probability zero.
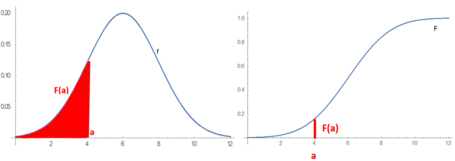
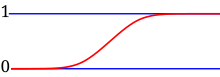
For such continuous random variables, only events that include infinitely many outcomes such as intervals have probability greater than 0.
For example, consider measuring the weight of a piece of ham in the supermarket, and assume the scale can provide arbitrarily many digits of precision.
However, for the same use case, it is possible to meet quality control requirements such as that a package of "500 g" of ham must weigh between 490 g and 510 g with at least 98% probability.
One of the most general descriptions, which applies for absolutely continuous and discrete variables, is by means of a probability function
can take as argument subsets of the sample space itself, as in the coin toss example, where the function
However, because of the widespread use of random variables, which transform the sample space into a set of numbers (e.g.,
More complex experiments, such as those involving stochastic processes defined in continuous time, may demand the use of more general probability measures.
[10] Some key concepts and terms, widely used in the literature on the topic of probability distributions, are listed below.
Additionally, the discrete uniform distribution is commonly used in computer programs that make equal-probability random selections between a number of choices.
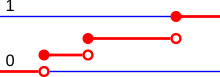
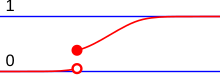
The points where jumps occur are precisely the values which the random variable may take.
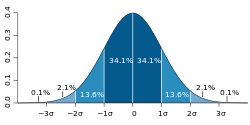
There are many examples of absolutely continuous probability distributions: normal, uniform, chi-squared, and others.
In the measure-theoretic formalization of probability theory, a random variable is defined as a measurable function
are extremely useful to model a myriad of phenomena,[7][5] since most practical distributions are supported on relatively simple subsets, such as hypercubes or balls.
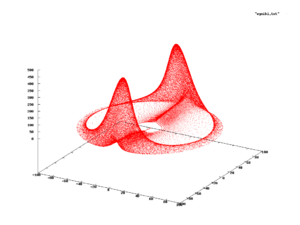
In these cases, the probability distribution is supported on the image of such curve, and is likely to be determined empirically, rather than finding a closed formula for it.
a subset of the support; if the probability measure exists for the system, one would expect the frequency of observing states inside set
Formally, the measure exists only if the limit of the relative frequency converges when the system is observed into the infinite future.
[28] The branch of dynamical systems that studies the existence of a probability measure is ergodic theory.
Note that even in these cases, the probability distribution, if it exists, might still be termed "absolutely continuous" or "discrete" depending on whether the support is uncountable or countable, respectively.
are then transformed via some algorithm to create a new random variate having the required probability distribution.
[29] A frequent problem in statistical simulations (the Monte Carlo method) is the generation of pseudo-random numbers that are distributed in a given way.
There is spread or variability in almost any value that can be measured in a population (e.g. height of people, durability of a metal, sales growth, traffic flow, etc.
); almost all measurements are made with some intrinsic error; in physics, many processes are described probabilistically, from the kinetic properties of gases to the quantum mechanical description of fundamental particles.
For these and many other reasons, simple numbers are often inadequate for describing a quantity, while probability distributions are often more appropriate.
The following is a list of some of the most common probability distributions, grouped by the type of process that they are related to.
The aim of distribution fitting is to predict the probability or to forecast the frequency of occurrence of the magnitude of the phenomenon in a certain interval.
The distribution giving a close fit is supposed to lead to good predictions.