Kurtosis
Similar to skewness, kurtosis provides insight into specific characteristics of a distribution.
Various methods exist for quantifying kurtosis in theoretical distributions, and corresponding techniques allow estimation based on sample data from a population.
It’s important to note that different measures of kurtosis can yield varying interpretations.
This number is related to the tails of the distribution, not its peak;[2] hence, the sometimes-seen characterization of kurtosis as "peakedness" is incorrect.
For this measure, higher kurtosis corresponds to greater extremity of deviations (or outliers), and not the configuration of data near the mean.
Excess kurtosis, typically compared to a value of 0, characterizes the “tailedness” of a distribution.
The Laplace distribution, for example, has tails that decay more slowly than a Gaussian, resulting in more outliers.
Other choices include γ2, to be similar to the notation for skewness, although sometimes this is instead reserved for the excess kurtosis.
Formulas related to the extensive property are more naturally expressed in terms of the excess kurtosis.
The reason not to subtract 3 is that the bare moment better generalizes to multivariate distributions, especially when independence is not assumed.
For a bivariate normal distribution, the cokurtosis tensor has off-diagonal terms that are neither 0 nor 3 in general, so attempting to "correct" for an excess becomes confusing.
It is true, however, that the joint cumulants of degree greater than two for any multivariate normal distribution are zero.
The underlying logic is straightforward: Kurtosis represents the average (or expected value) of standardized data raised to the fourth power.
The meaningful contributors to kurtosis are data values outside the peak region, i.e., the outliers.
Therefore, kurtosis primarily measures outliers and provides no information about the central "peak".
[5] Other incorrect interpretations include notions like “lack of shoulders” (where the “shoulder” refers vaguely to the area between the peak and the tail, or more specifically, the region about one standard deviation from the mean) or “bimodality.” [6] Balanda and MacGillivray argue that the standard definition of kurtosis “poorly captures the kurtosis, peakedness, or tail weight of a distribution.”Instead, they propose a vague definition of kurtosis as the location- and scale-free movement of probability mass from the distribution’s shoulders into its center and tails.
In terms of the original variable X, the kurtosis is a measure of the dispersion of X around the two values μ ± σ.
In fact, by Lagrange multiplier method, for any prescribed first n moments, if there exists some probability distribution of form
that has the prescribed moments (if it is feasible), then it is the maximal entropy distribution under the given constraints.
This yields a one-parameter leptokurtic family with zero mean, unit variance, zero skewness, and arbitrary non-negative excess kurtosis.
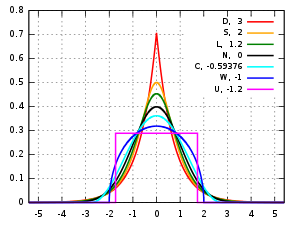
one obtains the standard normal density as the limiting distribution, shown as the black curve.
The red curve again shows the upper limit of the Pearson type VII family, with
The red curve decreases the slowest as one moves outward from the origin ("has fat tails").
Several well-known, unimodal, and symmetric distributions from different parametric families are compared here.
One cannot infer that high or low kurtosis distributions have the characteristics indicated by these examples.
An alternative estimator of the population excess kurtosis, which is unbiased in random samples of a normal distribution, is defined as follows:[3]
is the version found in Excel and several statistical packages including Minitab, SAS, and SPSS.
[17]: Page number needed The sample kurtosis is a useful measure of whether there is a problem with outliers in a data set.
Larger kurtosis indicates a more serious outlier problem, and may lead the researcher to choose alternative statistical methods.
This behavior, termed kurtosis convergence, can be used to detect image splicing in forensic analysis.