Vapor–liquid equilibrium
The equilibrium vapor pressure of a liquid is in general strongly dependent on temperature.
Distillation takes advantage of differences in concentrations of components in the liquid and vapor phases.
Much of the analysis depends on whether the vapor and liquid consist of a single component, or if they are mixtures.
If the liquid and vapor are pure, in that they consist of only one molecular component and no impurities, then the equilibrium state between the two phases is described by the following equations: where
[4]: 215 In other words, the temperature, pressure and molar Gibbs free energy are the same between the two phases when they are at equilibrium.
An equivalent, more common way to express the vapor–liquid equilibrium condition in a pure system is by using the concept of fugacity.
are the fugacities of the liquid and vapor, respectively, at the system temperature Ts and pressure Ps.
In a multicomponent system, where the vapor and liquid consist of more than one type of compounds, describing the equilibrium state is more complicated.
The partial molar Gibbs free energy is defined by: where G is the (extensive) Gibbs free energy, and ni is the amount of substance of component i. Binary mixture VLE data at a certain overall pressure, such as 1 atm, showing mole fraction vapor and liquid concentrations when boiling at various temperatures can be shown as a two-dimensional graph called a boiling-point diagram.
The mole fraction of component 2, represented by x2, is related to x1 in a binary mixture as follows: In multi-component mixtures in general with n components, this becomes: The preceding equilibrium equations are typically applied for each phase (liquid or vapor) individually, but the result can be plotted in a single diagram.
These vapor and liquid mole fractions are represented by two points on the same horizontal isotherm (constant T ) line.
When an entire range of temperatures vs. vapor and liquid mole fractions is graphed, two (usually curved) lines result.
The lower one, representing the mole fraction of the boiling liquid at various temperatures, is called the bubble point curve.
The upper one, representing the mole fraction of the vapor at various temperatures, is called the dew point curve.
If one wants to represent a VLE data for a three-component mixture as a boiling point "diagram", a three-dimensional graph can be used.
Each face of this triangular prism would represent a two-dimensional boiling-point diagram for the corresponding binary mixture.
The tendency of a given chemical species to partition itself preferentially between liquid and vapor phases is the Henry's law constant.
There can be VLE data for mixtures of four or more components, but such a boiling-point diagram is hard to show in either tabular or graphical form.
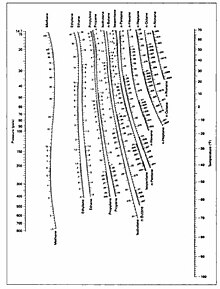
The values of the ratio Ki are correlated empirically or theoretically in terms of temperature, pressure and phase compositions in the form of equations, tables or graph such as the DePriester charts.
These types of VLE diagrams are used in the McCabe–Thiele method to determine the number of equilibrium stages (or theoretical plates) needed to distill a given composition binary feed mixture into one distillate fraction and one bottoms fraction.
Corrections can also be made to take into account the incomplete efficiency of each tray in a distillation column when compared to a theoretical plate.
Thus the P° pure vapor pressures for each component are a function of temperature (T): For example, commonly for a pure liquid component, the Clausius–Clapeyron relation may be used to approximate how the vapor pressure varies as a function of temperature.
This makes each of the partial pressures dependent on temperature also regardless of whether Raoult's law applies or not.
At a given Ptot such as 1 atm and a given liquid composition, T can be solved for to give the liquid mixture's boiling point or bubble point, although the solution for T may not be mathematically analytical (i.e., may require a numerical solution or approximation).
At boiling temperatures if Raoult's law applies, a number of the preceding equations in this section can be combined to give the following expressions for vapor mole fractions as a function of liquid mole fractions and temperature:
Once the bubble point T's as a function of liquid composition in terms of mole fractions have been determined, these values can be inserted into the above equations to obtain corresponding vapor compositions in terms of mole fractions.
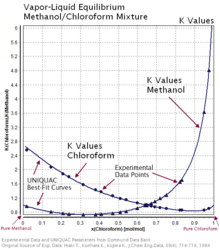
For many kinds of mixtures, particularly where there is interaction between components beyond simply the effects of dilution, Raoult's law does not work well for determining the shapes of the curves in the boiling point or VLE diagrams.
Even in such mixtures, there are usually still differences in the vapor and liquid equilibrium concentrations at most points, and distillation is often still useful for separating components at least partially.
For such mixtures, empirical data is typically used in determining such boiling point and VLE diagrams.
Chemical engineers have done a significant amount of research trying to develop equations for correlating and/or predicting VLE data for various kinds of mixtures which do not obey Raoult's law well.