Tropical Storm Etau (2009)
Tracking in a curved path around the edge of a subtropical ridge, Etau continued to intensify as it neared Japan.
By August 10, the cyclone reached its peak intensity as a weak tropical storm with winds of 75 km/h (45 mph 10-minute sustained) and a barometric pressure of 992 hPa (mbar).
Increasing wind shear led to the center becoming devoid of convection and the system eventually weakened to a tropical depression on August 13.
Although Etau did not make landfall, the outer bands of the storm produced torrential rainfall in Japan, peaking at 326.5 mm (12.85 in).
Tropical Storm Etau originated on August 5 out of an area of low pressure associated with disorganized convective activity located about 550 km (280 mi) east-northeast of Guam.
Convective turning began to appear on satellite imagery and a tropical upper tropospheric trough (TUTT) cell to the north provided a northward component to the system's movement.
[13] Early on August 11, the JMA reported that the storm winds had peaked at 75 km/h (45 mph 10-minute sustained) and a barometric pressure of 992 hPa (mbar).
[17] Early the following day, the JTWC issued their final advisory on Etau as they reported it had weakened to a tropical depression well to the east of Japan.
[20] In anticipation of wind gusts up to 126 km/h (78 mph) and heavy rains, Japanese officials evacuated roughly 47,000 residents from western regions along the coast as gale warnings were declared by the JMA.
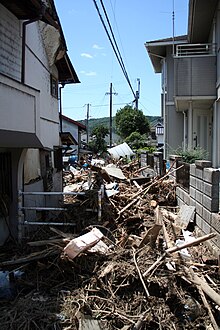
[1] As Tropical Storm Etau brushed Japan on August 10, torrential rains fell within its outer bands.
The affected region was especially susceptible to landslides due to recent seismic activity, with a magnitude 6.4 earthquake taking place on August 10.
[31] Days later, the Japanese Fire and Disaster Management Agency finalized the death toll at 26 with one other missing,[1] making Etau the deadliest tropical cyclone to impact Hyōgo Prefecture, Japan since Typhoon Tokage in 2004.

Tropical storm (39–73 mph, 63–118 km/h)
Category 1 (74–95 mph, 119–153 km/h)
Category 2 (96–110 mph, 154–177 km/h)
Category 3 (111–129 mph, 178–208 km/h)
Category 4 (130–156 mph, 209–251 km/h)
Category 5 (≥157 mph, ≥252 km/h)
Unknown