Datasaurus dozen
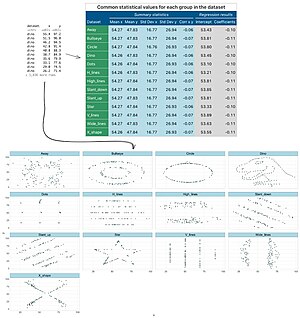
The Datasaurus dozen comprises thirteen data sets that have nearly identical simple descriptive statistics to two decimal places, yet have very different distributions and appear very different when graphed.
The following table contains summary statistics for all thirteen data sets.
The thirteen data sets were labeled as the following: Similar to the Anscombe's quartet, the Datasaurus dozen was designed to further illustrate the importance of looking at a set of data graphically before starting to analyze according to a particular type of relationship, and the inadequacy of basic statistic properties for describing realistic data sets.
[7][8] It was proposed by Maarten Lambrechts that this data set also be called "Anscombosaurus".
They made small, random, and biased changes to each point towards the desired shape.