Genome architecture mapping
[3] GAM is the first genome-wide method for capturing three-dimensional proximities between any number of genomic loci without ligation.
A large set of values can be produced that represents the strength of nuclear profiles’ presence within a genome.
Some examples of how these visuals can be interpreted include bar graphs that show the radial position and chromatin compaction levels of nuclear profiles, they can be split into categories to give a generalization of how often nuclear profiles are detected within a genomic window.
These charts can be made to compare groups of nuclear profiles with each other and their differences in how they occur within these features is shown graphically.
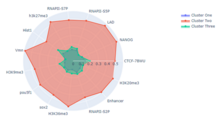
Within each of these clusters the nuclear profiles are then given a value from 1 to 5 based on their radial position and this data is fed into a bar graph to give a visualization.
This radar chart to the right shows 3 clusters of nuclear profiles’ percentage of occurrence within certain features of the mouse genome.
The percentage of how often nuclear profiles within a cluster occur within the same windows that are detected within a feature are then displayed by the radar chart.
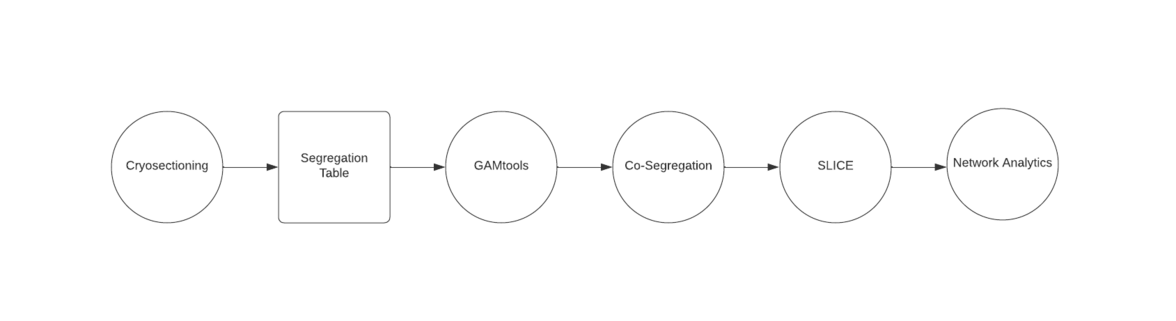
Cryosections are produced according to the Tokuyasu method, involving stringent fixation to preserve nuclear and cellular architecture, cryoprotection with a sucrose-PBS solution, before freezing in liquid nitrogen.
GAMtools is a collection of software utilities for Genome Architecture Mapping data developed by Robert Beagrie.
After the mapping has finished, GAMtools will compute the number of reads from each nuclear profile which overlap with each window in the background genome file.
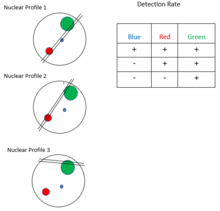
As shown in the figure, loci with a low compaction level are expected to be intersected more often by the cryosection slices.
GAMtools uses this information to assign a compaction value to each locus based on its detection frequency across many nuclear profiles.
This allows a researcher to make assumptions about which genes are currently active in a cell, using the results of the GAMtools data.
The figure to the right illustrates how GAMtools looks at each NP's detection rate to estimate the volume, in order to determine the compaction or the radial position.
This process results in a collection of nucleus slices (nuclear profiles) which contain pieces of DNA (genomic windows).
K-means would work well for this particular problem in the sense that it would cluster every nuclear profile according to a similarity measure, but it also has drawbacks.
[6] GAMtools is a suite of software tools which can be used to extrapolate data from the segregation table, some of the results of which will be discussed below.
Centrality-based communities can be thought of as analogous to celebrities and their fan bases on a social media network.
Something of note is that in our social network analogy above, an eigenvector centrality may not be accurate because one person who follows many celebrities may not have any influence over them.
In GAM analysis, it is generally assumed that the graph is undirected, so that if eigenvector centrality were to be used it would be accurate.
SLICE (StatisticaL Inference of Co-sEgregation) plays a key role in GAM data analysis.
[1] It was developed in the laboratory of Mario Nicodemi to provide a math model to identify the most specific interactions among loci from GAM cosegregation data.
[1] The SLICE Model is based on a hypothesis that the probability of non-interacting loci falls into the same nuclear profile is predictable.
The SLICE prediction for radius matches Monte Carlo simulations(more detail about this step will be updated after get the license of the figure in the original author's paper.).
With the results of previous processes, the occurrence probability of a pair of loci in one nuclear profile can be calculated by statistics method.
Taking slices and samples of tissues derives nuclear profiles, and the ranges of windows found within a genome.
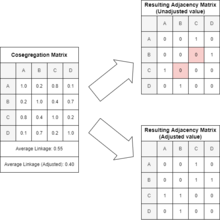
Combining each windows normalized linkage value into a chart or matrix allows for the genome to be mapped and analyzed using a heatmap or another graph.
The co-segregation and normalized linkage values can also be used for further calculations and analysis such as centrality and community detection which is discussed in the next section.
When analyzing the heatmap displayed from the normalized linkage matrix, the colors of each block are the key.
This is the highest linkage value, which is shown in the diagonal line of yellow blocks within the map where each window is compared against itself.