One- and two-tailed tests
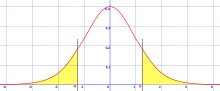
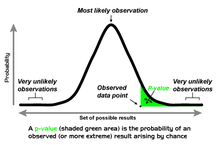
Alternative names are one-sided and two-sided tests; the terminology "tail" is used because the extreme portions of distributions, where observations lead to rejection of the null hypothesis, are small and often "tail off" toward zero as in the normal distribution, colored in yellow, or "bell curve", pictured on the right and colored in green.
Two-tailed tests are only applicable when there are two tails, such as in the normal distribution, and correspond to considering either direction significant.
[1][2] In the approach of Ronald Fisher, the null hypothesis H0 will be rejected when the p-value of the test statistic is sufficiently extreme (vis-a-vis the test statistic's sampling distribution) and thus judged unlikely to be the result of chance.
One may report that the left or right tail probability as the one-tailed p-value, which ultimately corresponds to the direction in which the test statistic deviates from H0.
Alternatively, the critical region would solely exist on the single tail end with an area of
[5] In the archetypal lady tasting tea experiment, Fisher tested whether the lady in question was better than chance at distinguishing two types of tea preparation, not whether her ability was different from chance, and thus he used a one-tailed test.
In coin flipping, the null hypothesis is a sequence of Bernoulli trials with probability 0.5, yielding a random variable X which is 1 for heads and 0 for tails, and a common test statistic is the sample mean (of the number of heads)
However, if testing for whether the coin is biased towards heads or tails, a two-tailed test would be used, and a data set of five heads (sample mean 1) is as extreme as a data set of five tails (sample mean 0).
This is a one-tailed definition, and the chi-squared distribution is asymmetric, only assuming positive or zero values, and has only one tail, the upper one.
The distinction between one-tailed and two-tailed tests was popularized by Ronald Fisher in the influential book Statistical Methods for Research Workers,[7] where he applied it especially to the normal distribution, which is a symmetric distribution with two equal tails.
In the case of a symmetric distribution such as the normal distribution, the one-tailed p-value is exactly half the two-tailed p-value:[7] Some confusion is sometimes introduced by the fact that in some cases we wish to know the probability that the deviation, known to be positive, shall exceed an observed value, whereas in other cases the probability required is that a deviation, which is equally frequently positive and negative, shall exceed an observed value; the latter probability is always half the former.
Fisher emphasized the importance of measuring the tail – the observed value of the test statistic and all more extreme – rather than simply the probability of specific outcome itself, in his The Design of Experiments (1935).
If the test is performed using the actual population mean and variance, rather than an estimate from a sample, it would be called a one-tailed or two-tailed Z-test.
The statistical tables for t and for Z provide critical values for both one- and two-tailed tests.
That is, they provide the critical values that cut off an entire region at one or the other end of the sampling distribution as well as the critical values that cut off the regions (of half the size) at both ends of the sampling distribution.