Map
Like any graphic, a map may be fixed to paper or other durable media, or may be displayed on a transitory medium such as a computer screen.
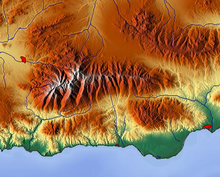
The location information showed by maps may include contour lines, indicating constant values of elevation, temperature, rainfall, etc.
Although the scale statement is nominal it is usually accurate enough for most purposes unless the map covers a large fraction of the Earth.
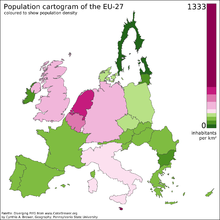
Some maps, called cartograms, have the scale deliberately distorted to reflect information other than land area or distance.
For example, this map (at the left) of Europe has been distorted to show population distribution, while the rough shape of the continent is still discernible.
The geographic structure is respected but the tube lines (and the River Thames) are smoothed to clarify the relationships between stations.
For example, cartographers may simply omit military installations or remove features solely to enhance the clarity of the map.
Known as decluttering, the practice makes the subject matter that the user is interested in easier to read, usually without sacrificing overall accuracy.
These cartographers typically place such information in an otherwise "blank" region "inside" the map—cartouche, map legend, title, compass rose, bar scale, etc.
As a form of Design, particularly closely related to Graphic design, map making incorporates scientific knowledge about how maps are used, integrated with principles of artistic expression, to create an aesthetically attractive product, carries an aura of authority, and functionally serves a particular purpose for an intended audience.
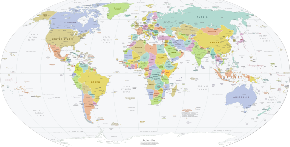
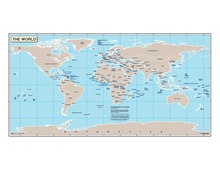
The most important purpose of the political map is to show territorial borders and administrative regions; the purpose of the physical map is to show features of geography such as mountains, soil type, or land use including infrastructures such as roads, railroads, and buildings.
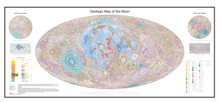
Geological maps show not only the physical surface, but characteristics of the underlying rock, fault lines, and subsurface structures.
Having local information such as rainfall level, distribution of wildlife, or demographic data integrated within the map allows more efficient analysis and better decision making.
In the pre-electronic age such superimposition of data led Dr. John Snow to identify the location of an outbreak of cholera.
[9] These maps can be compiled both for individual climatic features (temperature, precipitation, humidity) and for combinations of them at the earth's surface and in the upper layers of the atmosphere.
When generating the map, spatial interpolation can be used to synthesize values where there are no measurements, under the assumption that conditions change smoothly.
Climatic maps generally apply to individual months and the year as a whole, sometimes to the four seasons, to the growing period, and so forth.
On maps compiled from the observations of ground meteorological stations, atmospheric pressure is converted to sea level.
The pressure field in the free atmosphere is represented either by maps of the distribution of pressure at different standard altitudes—for example, at every kilometer above sea level—or by maps of baric topography on which altitudes (more precisely geopotentials) of the main isobaric surfaces (for example, 900, 800, and 700 millibars) counted off from sea level are plotted.
The temperature, humidity, and wind on aero climatic maps may apply either to standard altitudes or to the main isobaric surfaces.
Isolines are drawn on maps of such climatic features as the long-term mean values (of atmospheric pressure, temperature, humidity, total precipitation, and so forth) to connect points with equal values of the feature in question—for example, isobars for pressure, isotherms for temperature, and isohyets for precipitation.
In 1974, the coastline and relief of Scotland were laid out by Kazimierz Trafas, a Polish student geographer-planner, based on existing Bartholomew Half-Inch map sheets.
Engineering infrastructure was put in place to surround it with a sea of water and at the General's request some of the main rivers were even arranged to flow from headwaters pumped into the mountains.
Residing in the British Columbia Pavilion at the Pacific National Exhibition (PNE) in Vancouver from 1954 to 1997 it was viewed by millions of visitors.