Stereographic projection
Intuitively, the stereographic projection is a way of picturing the sphere as the plane, with some inevitable compromises.
Because the sphere and the plane appear in many areas of mathematics and its applications, so does the stereographic projection; it finds use in diverse fields including complex analysis, cartography, geology, and photography.
Its earliest extant description is found in Ptolemy's Planisphere (2nd century AD), but it was ambiguously attributed to Hipparchus (2nd century BC) by Synesius (c. 400 AD),[2] and Apollonius's Conics (c. 200 BC) contains a theorem which is crucial in proving the property that the stereographic projection maps circles to circles.
Hipparchus, Apollonius, Archimedes, and even Eudoxus (4th century BC) have sometimes been speculatively credited with inventing or knowing of the stereographic projection,[3] but some experts consider these attributions unjustified.
[2] Ptolemy refers to the use of the stereographic projection in a "horoscopic instrument", perhaps the anaphoric clock [fr; it] described by Vitruvius (1st century BC).
[4][5] By the time of Theon of Alexandria (4th century), the planisphere had been combined with a dioptra to form the planispheric astrolabe ("star taker"),[3] a capable portable device which could be used for measuring star positions and performing a wide variety of astronomical calculations.
In the 16th and 17th century, the equatorial aspect of the stereographic projection was commonly used for maps of the Eastern and Western Hemispheres.
[8] François d'Aguilon gave the stereographic projection its current name in his 1613 work Opticorum libri sex philosophis juxta ac mathematicis utiles (Six Books of Optics, useful for philosophers and mathematicians alike).
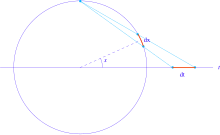
In cylindrical coordinates (r, θ, z) on the sphere and polar coordinates (R, Θ) on the plane, the projection and its inverse are Some authors[12] define stereographic projection from the north pole (0, 0, 1) onto the plane z = −1, which is tangent to the unit sphere at the south pole (0, 0, −1).
In other words, S is the locus of zeros of a non-singular quadratic form f(x0, ..., xn+1) in the homogeneous coordinates xi.
Parallel lines, which do not intersect in the plane, are transformed to circles tangent at projection point.
(Similar remarks hold about the real projective plane, but the intersection relationships are different there.)
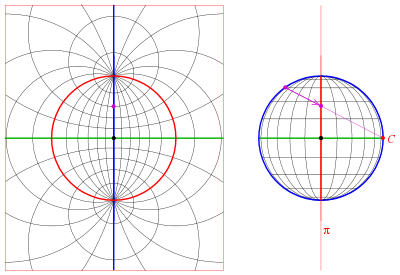
In the figure, the area-distorting property of the stereographic projection can be seen by comparing a grid sector near the center of the net with one at the far right or left.
For an example of the use of the Wulff net, imagine two copies of it on thin paper, one atop the other, aligned and tacked at their mutual center.
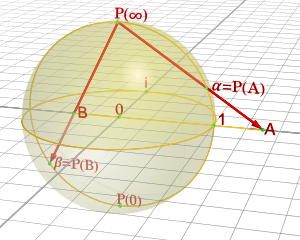
This facilitates an elegant and useful notion of infinity for the complex numbers and indeed an entire theory of meromorphic functions mapping to the Riemann sphere.
Horizontal lines through the origin intersect the southern hemisphere in two antipodal points along the equator, which project to the boundary of the disk.
Prior to the availability of computers, stereographic projections with great circles often involved drawing large-radius arcs that required use of a beam compass.
In elementary arithmetic geometry, stereographic projection from the unit circle provides a means to describe all primitive Pythagorean triples.
The pair of trigonometric functions (sin x, cos x) can be thought of as parametrizing the unit circle.
The fundamental problem of cartography is that no map from the sphere to the plane can accurately represent both angles and areas.
The set of circles passing through the point of projection have unbounded radius, and therefore degenerate into lines.
In crystallography, the orientations of crystal axes and faces in three-dimensional space are a central geometric concern, for example in the interpretation of X-ray and electron diffraction patterns.
In electron diffraction, Kikuchi line pairs appear as bands decorating the intersection between lattice plane traces and the Ewald sphere thus providing experimental access to a crystal's stereographic projection.
Researchers in structural geology are concerned with the orientations of planes and lines for a number of reasons.
Unlike crystallography, the southern hemisphere is used instead of the northern one (because the geological features in question lie below the Earth's surface).
Kinematic analysis within stereographic projection is used to assess the potential for various modes of rock slope failures—such as plane, wedge, and toppling failures—which occur due to the presence of unfavorably oriented discontinuities.
[22][23] This technique is particularly useful for visualizing the orientation of rock slopes in relation to discontinuity sets, facilitating the assessment of the most likely failure type.
Additionally, some authors have developed graphical methods based on stereographic projection to easily calculate geometrical correction parameters—such as those related to the parallelism between the slope and discontinuities, the dip of the discontinuity, and the relative angle between the discontinuity and the slope—for rock mass classifications in slopes, including slope mass rating (SMR)[24] and rock mass rating.
[26] Compared to more traditional fisheye lenses which use an equal-area projection, areas close to the edge retain their shape, and straight lines are less curved.
The stereographic projection has been used to map spherical panoramas, starting with Horace Bénédict de Saussure's in 1779.