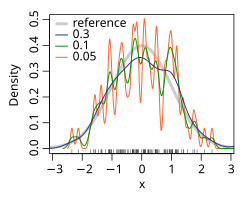
Density estimation
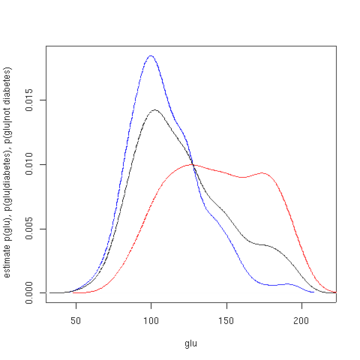
Density estimates can give a valuable indication of such features as skewness and multimodality in the data.
In some cases they will yield conclusions that may then be regarded as self-evidently true, while in others all they will do is to point the way to further analysis and/or data collection.
[5] An important aspect of statistics is often the presentation of data back to the client in order to provide explanation and illustration of conclusions that may possibly have been obtained by other means.
Density estimates are ideal for this purpose, for the simple reason that they are fairly easily comprehensible to non-mathematicians.
More examples illustrating the use of density estimates for exploratory and presentational purposes, including the important case of bivariate data.