Flow map
The movement being mapped may be that of anything, including people, highway traffic, trade goods, water, ideas, telecommunications data, etc.
The earliest known map to visually represent the volume of flow were two maps by engineer Henry Drury Harness, published in 1838 as part of a report on the potential for railroad construction in Ireland, showing the quantity of cargo traffic by road and canal.
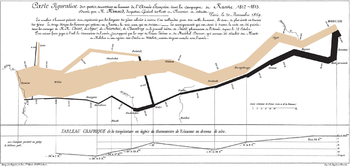
[5] During the 1850s and 1860s, Minard published forty-two flow maps on a wide variety of topics among his cartes figuratives.
[citation needed] A wide variety of flow maps have been created since the 1830s, showing movement in many forms.
Topics relating to human geography include: migration, travel, international trade, logistics, public utilities (water, sewer, electricity, telecommunications), and traffic, among others.
In a 1987 thesis, Mary Parks identified several distinct types of flow maps,[13] which has been widely cited although her list was not comprehensive and more are included here.
In this type, the primary intent is to show the existence of a connection between two places, often accompanied by a representation of the volume of flow and/or direction.
[12] The route is generally not important to the audience, so connecting lines are often straight or slightly curved.
Origin-destination maps have a unique design focus on the schematic shape of the connecting lines.
[15] This type is exemplified by a balanced focus on origin-destination nodes, the routes of travel between them (usually highly generalized), and the volume of flow.
Designing distribution maps requires some care and craft in drafting the flow lines so they divide with proper widths, and at smooth curving angles.
Computation experiments have shown the potential for generating these automatically,[2] but today most are drawn semi-manually using GIS and graphics software.
The routes may be precise or highly generalized (as in many transit maps), and may or may not represent amount or speed of flow.
In 1688, Edmund Halley mapped the trade winds using an array of short line segments oriented in the direction of air flow.
Unit vectors and streamlets have been proposed as a general term for point-based flow symbols, but neither is in wide usage.
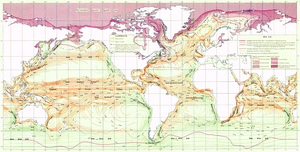
Another visualization option for vector fields is to draw streamlines, which connect points that would flow into each other; this has been commonly used to represent ocean currents since the early 19th Century.
[5]: 82 Among Tobler's 1981 computer algorithms were models of vector fields to generate "streaklines," and subsequent work has improved results.