Regression toward the mean
Then, each student's score would be a realization of one of a set of independent and identically distributed random variables, with an expected mean of 50.
In this case, the subset of students scoring above average would be composed of those who were skilled and had not especially bad luck, together with those who were unskilled, but were extremely lucky.
If your favourite sports team won the championship last year, what does that mean for their chances for winning next season?
But the greater the extent this is due to luck (other teams embroiled in a drug scandal, favourable draw, draft picks turned out to be productive, etc.
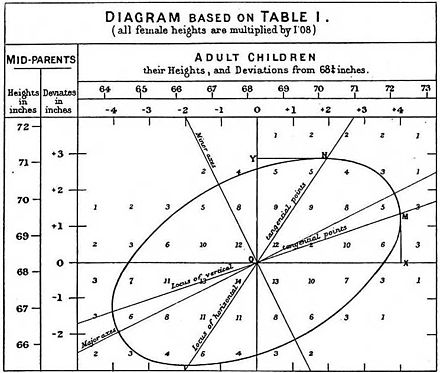
By measuring the heights of hundreds of people, he was able to quantify regression to the mean, and estimate the size of the effect.
Galton wrote that, "the average regression of the offspring is a constant fraction of their respective mid-parental deviations".
[11]Galton coined the term "regression" to describe an observable fact in the inheritance of multi-factorial quantitative genetic traits: namely that traits of the offspring of parents who lie at the tails of the distribution often tend to lie closer to the centre, the mean, of the distribution.
He quantified this trend, and in doing so invented linear regression analysis, thus laying the groundwork for much of modern statistical modeling.
Since then, the term "regression" has been used in other contexts, and it may be used by modern statisticians to describe phenomena such as sampling bias which have little to do with Galton's original observations in the field of genetics.
Take a hypothetical example of 1,000 individuals of a similar age who were examined and scored on the risk of experiencing a heart attack.
Even if the interventions are worthless, the test group would be expected to show an improvement on their next physical exam, because of regression toward the mean.
A mathematical calculation for shrinkage can adjust for this effect, although it will not be as reliable as the control group method (see also Stein's example).
It is possible for changes between the measurement times to augment, offset or reverse the statistical tendency to regress toward the mean.
One exasperated reviewer, Harold Hotelling, likened the book to "proving the multiplication table by arranging elephants in rows and columns, and then doing the same for numerous other kinds of animals".
[13] The calculation and interpretation of "improvement scores" on standardized educational tests in Massachusetts probably provides another example of the regression fallacy.
It was quickly noted that most of the worst-performing schools had met their goals, which the Department of Education took as confirmation of the soundness of their policies.
The psychologist Daniel Kahneman, winner of the 2002 Nobel Memorial Prize in Economic Sciences, pointed out that regression to the mean might explain why rebukes can seem to improve performance, while praise seems to backfire.
[14] I had the most satisfying Eureka experience of my career while attempting to teach flight instructors that praise is more effective than punishment for promoting skill-learning.
But I knew that this demonstration would not undo the effects of lifelong exposure to a perverse contingency.The regression fallacy is also explained in Rolf Dobelli's The Art of Thinking Clearly.
UK law enforcement policies have encouraged the visible siting of static or mobile speed cameras at accident blackspots.
This policy was justified by a perception that there is a corresponding reduction in serious road traffic accidents after a camera is set up.
[15][16][17] Statistical analysts have long recognized the effect of regression to the mean in sports; they even have a special name for it: the "sophomore slump".
John Hollinger has an alternative name for the phenomenon of regression to the mean: the "fluke rule"[citation needed], while Bill James calls it the "Plexiglas Principle".
Similarly, the law of large numbers states that in the long term, the average will tend toward the expected value, but makes no statement about individual trials.
By contrast, the gambler's fallacy incorrectly assumes that the coin is now "due" for a run of tails to balance out.
The opposite effect is regression to the tail, resulting from a distribution with non-vanishing probability density toward infinity.
Here the best will be understood as in the least-squares approach: such a line that minimizes the sum of squared residuals of the linear regression model.
In other words, numbers α and β solve the following minimization problem: Using calculus it can be shown that the values of α and β that minimize the objective function Q are where rxy is the sample correlation coefficient between x and y, sx is the standard deviation of x, and sy is correspondingly the standard deviation of y. Horizontal bar over a variable means the sample average of that variable.
We now take a random widget from the population, and denote its X1 value by c. (c may be greater than, equal to, or smaller than μ.)
[21] If a pair (X, Y) of random variables follows a bivariate normal distribution, then the conditional mean E(Y|X) is a linear function of X.