History of spectroscopy
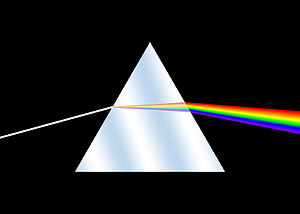
Isaac Newton first applied the word spectrum to describe the rainbow of colors that combine to form white light.
During the early 1800s, Joseph von Fraunhofer conducted experiments with dispersive spectrometers that enabled spectroscopy to become a more precise and quantitative scientific technique.
The works of Athanasius Kircher (1646), Jan Marek Marci (1648), Robert Boyle (1664), and Francesco Maria Grimaldi (1665), predate Newton's optics experiments (1666–1672).
[11][12] In 1802, William Hyde Wollaston built a spectrometer, improving on Newton's model, that included a lens to focus the Sun's spectrum on a screen.
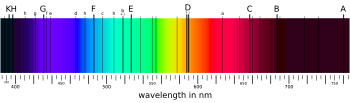
[15] Joseph von Fraunhofer made a significant experimental leap forward by replacing a prism with a diffraction grating as the source of wavelength dispersion.
Fraunhofer built off the theories of light interference developed by Thomas Young, François Arago and Augustin-Jean Fresnel.
The interference achieved by a diffraction grating both improves the spectral resolution over a prism and allows for the dispersed wavelengths to be quantified.
B. L. Foucault experimentally demonstrated that absorption and emission lines appearing at the same wavelength are both due to the same material, with the difference between the two originating from the temperature of the light source.
August Beer observed a relationship between light absorption and concentration[38] and created the color comparator which was later replaced by a more accurate device called the spectrophotometer.
In 1871, Stoney suggested using a wavenumber scale for spectra and Hartley[42] followed up, finding constant wave-number differences in the triplets of zinc.
He also postulated the proton, calling it a “positive electron.” He said the destruction of this type of atom making up matter “is an occurrence of infinitely small probability.”[50] The first decade of the 20th century brought the basics of quantum theory (Planck, Einstein)[51][52] and interpretation of spectral series of hydrogen by Lyman[53] in VUV and by Paschen[54] in infrared.
[60]: 83 Bohr published a theory of the hydrogen-like atoms that could explain the observed wavelengths of spectral lines due to electrons transitioning from different energy states.
These are observed in very hot plasmas (laboratory or astrophysical) or in accelerator experiments (beam-foil, electron beam ion trap (EBIT)).
The lowest exited electron shells of such ions decay into stable ground states producing photons in VUV, EUV and soft X-ray spectral regions (so-called resonance transitions).
Millikan,[66] Sawyer,[67] Bowen[68] used electric discharges in vacuum to observe some emission spectral lines down to 13 nm they prescribed to stripped atoms.
In 1927 Osgood[69] and Hoag[70] reported on grazing incidence concave grating spectrographs and photographed lines down to 4.4 nm (Kα of carbon).
In the same period Manne Siegbahn constructed a very sophisticated grazing incidence spectrograph that enabled Ericson and Edlén[72] to obtain spectra of vacuum spark with high quality and to reliably identify lines of multiply ionized atoms up to O VI, with five stripped electrons.
Russel and Saunders[74] proposed their coupling scheme for the spin-orbit interaction and their generally recognized notation for spectral terms.
The most exciting event was in 1942, when Edlén[76] proved the identification of some solar coronal lines on the basis of his precise analyses of spectra of MIA.
[77][78] Progress in ion accelerators stimulated beam-foil spectroscopy as a means to measure lifetimes of exited states of MIA.
[81] It was a real upheaval of works on MIA in USA, England, France, Italy, Israel, Sweden, Russia and other countries[82][83] A new page in the spectroscopy of MIA may be dated as 1986 with development of EBIT (Levine and Marrs, LLNL) due to a favorable composition of modern high technologies such as cryogenics, ultra-high vacuum, superconducting magnets, powerful electron beams and semiconductor detectors.
During World War II, the U.S. government contracted different companies to develop a method for the polymerization of butadiene to create rubber, but this could only be done through analysis of C4 hydrocarbon isomers.
[87] The maser was invented by Charles Townes and other spectroscopists to stimulate matter to determine the radiative frequencies that specific atoms and molecules emitted.
[87] This led to an idea a few years later to use the visible and eventually the infrared ranges of light for spectroscopy that became a reality with the help of Arthur Schawlow.