[1] They are distinguished from other 3D representations, such as the ball-and-stick and skeletal models, by the use of the "full size" space-filling spheres for the atoms.
Crystallographic data are the starting point for understanding static molecular structure, and these data contain the information rigorously required to generate space-filling representations (e.g., see these crystallographic models); most often, however, crystallographers present the locations of atoms derived from crystallography via "thermal ellipsoids" whose cut-off parameters are set for convenience both to show the atom locations (with anisotropies), and to allow representation of the covalent bonds or other interactions between atoms as lines.
In short, for reasons of utility, crystallographic data historically have appeared in presentations closer to ball-and-stick models.
In 1952, Robert Corey and Linus Pauling described accurate scale models of molecules which they had built at Caltech.
The two spheres were then firmly held together by a metal rod inserted into the pair of opposing bushing (with fastening by screws).
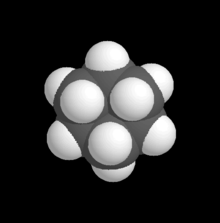
A space-filling model of
n
-octane
, the straight chain (normal)
hydrocarbon
composed of 8 carbons and 18 hydrogens, formulae: CH
3
CH
2
(CH
2
)
4
CH
2
CH
3
or
C
8
H
18
. Note, the representative shown is of a
single
conformational
"pose"
of a population of molecules, which, because of low
Gibbs energy
barriers to rotation about its carbon-carbon bonds (giving the carbon "chain" great flexibility), normally is composed of a very large number of different such conformations (e.g., in solution).
An example of a three-dimensional, space-filling model of a complex molecule,
THC
, the active agent in marijuana.
An example of a 3D, space-filling model of a simple molecule,
sulfur dioxide
, SO
2
, showing the
electrostatic potential surface
, computed for the molecule using the
Spartan
software suite
of
computational chemistry
tools. It is shaded from blue for
electropositive
areas to red for
electronegative
areas. The surface was generated by calculating the energy of interaction of a spherical point positive charge (e.g., a proton, H
+,
) with the molecule's atoms and bonding electrons, in a series of discrete computational steps. Here, the electrostatic surface emphasizes the electron deficiency of the sulfur atom, suggesting interactions in which it might engage, and
chemical reactions
it might undergo.